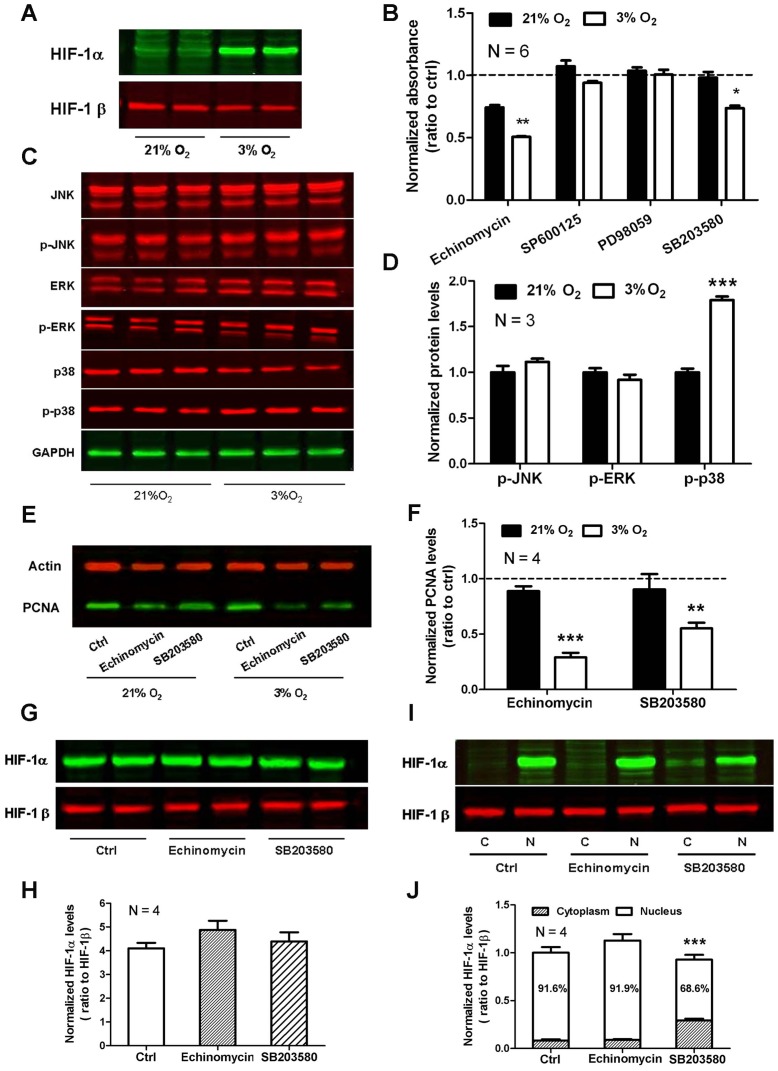
Figure 2. HIF-1α and p38 are involved in hypoxia-induced rMSC proliferation.
(A) HIF-1α is stably expressed in rMSCs cultured under 3% O2. (B) MTT array for the effect of HIF-1α and MAPKs inhibitors on cell viability of rMSCs cultured under 21% O2 or 3% O2. The data are presented as means ± SEM of 6 individual wells. (C) Western blot analysis of phosphorylated JNK, ERK and p38 in rMSCs cultured under 21% O2 or 3% O2. Total JNK, ERK and p38 were used as their respective internal control. The graph presented is representative of 3 independent experiments with similar results. (D) Quantitative analysis of phosphorylated JNK, ERK and p38 in C. (E) Western blot analysis of PCNA in rMSCs after treatment with HIF-1α inhibitor echinomycin or p38 inhibitor SB203580. The graph presented is representative of 4 independent experiments with similar results. (F) Quantitative analysis of PCNA in E. (G) Western blot analysis of total HIF-1α in rMSCs under 3% O2 after treatment with echinomycin or SB203580. HIF-1β was used as an internal control. The graph presented is representative of 4 independent experiments with similar results. (H) Quantitative analysis of HIF-1α in G. (I) Western blot analysis of cytoplasmic and nuclear HIF-1α in rMSCs under 3% O2 after treatment with echinomycin or SB203580. The graph presented is representative of 4 independent experiments with similar results. (J) Quantitative analysis of cytoplasmic and nuclear HIF-1α in I. Data represent mean ± SEM, *P<0.05, **P<0.01, ***P<0.001.

