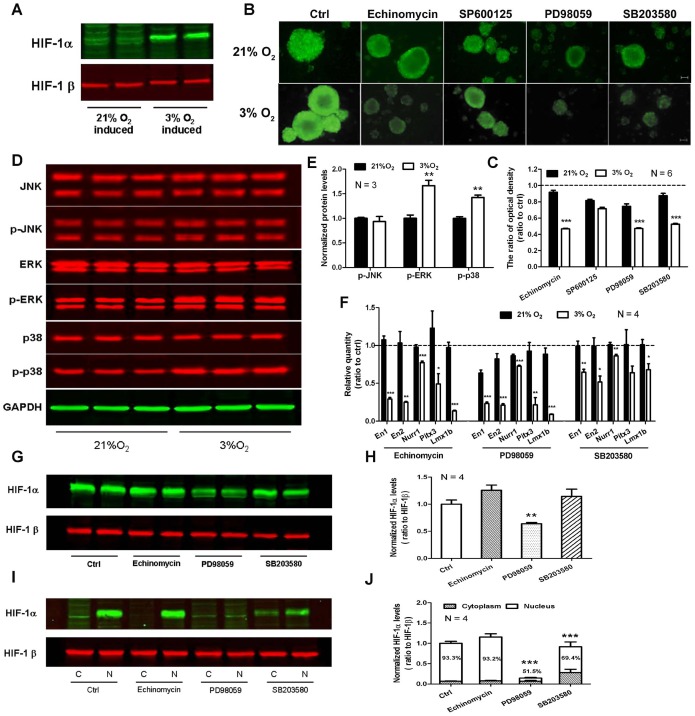
Figure 4. HIF-1α, ERK and p38 are involved in hypoxia-induced neural differentiation of rMSCs.
(A) HIF-1α is stably expressed in 3% O2-induced neurospheres. (B) Immunostaining of nestin in rMSC-derived neurospheres after respective treatment with HIF-1α inhibitor echinomycin, JNK inhibitor SP600125, ERK inhibitor PD98059 and p38 inhibitor SB203580. Scale bar = 100 µm. (C) Quantitative analysis of optical density of nestin expression in B by densitometry. The data are presented as means ± SEM of 6 individual wells. (D) Western blot analysis of phosphorylated JNK, ERK and p38 in rMSC-derived neurospheres. The graph presented is representative of 3 independent experiments with similar results. (E) Quantitative analysis of phosphorylated JNK, ERK and p38 in D. (F) The effect of inhibitors on mRNA of En1, En2, Nurr1, Pitx3 and Lmx1b in rMSC-derived neurospheres. The data presented are normalized to their respective control (n = 4). (G) Western blot analysis of total HIF-1α in 3% O2-induced neurospheres after respective treatment with echinomycin, PD98059 and SB203580. HIF-1β was used as an internal control. The graph presented is representative of 4 independent experiments with similar results. (H) Quantitative analysis of HIF-1α in G. (I) Western blot analysis of cytoplasmic and nuclear HIF-1α in 3% O2-induced neurospheres after respective treatment with echinomycin, PD98059 and SB203580. The graph presented is representative of 4 independent experiments with similar results. (J) Quantitative analysis of cytoplasmic and nuclear HIF-1α in I. Data represent mean ± SEM, *P<0.05, **P<0.01, ***P<0.001.

