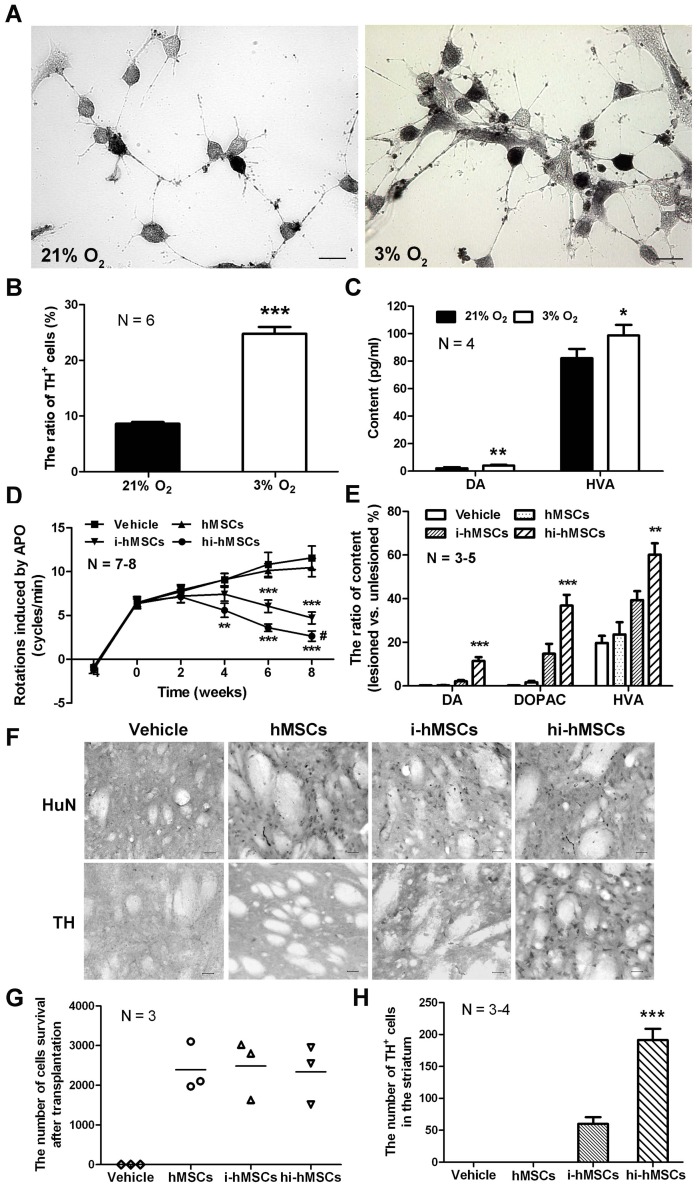
Figure 5. Transplantation and behavioral recovery of parkinsonian rats.
(A) TH immunohistochemistry of differentiated hMSCs induced by β-mercaptoethanol under 21% O2 or 3% O2. Scale bar = 20 µm. (B) The percentage of TH+ cells in A. The data are presented as means ± SEM of 6 individual wells. (C) HPLC detection of DA and HVA content in differentiatiated hMSCs induced under 21% O2 or 3% O2. The data are presented as means ± SEM of 4 individual wells. (D) Apomorphine-induced rotation from 4 weeks before transplantation to the eighth week after transplantation. n = 7-8 each group. # P<0.05, versus the rotation at 0 week in the same group. (E) The relative striatal content of DA and its metabolites, DOPAC and HVA, after transplantation. n = 3-5 each group. (F) Cells survival after transplantation were stained using anti-HuN antibody or anti-TH antibody. (G) Cell count of HuN+ cells in F. n = 3 each group. (H) Cell count of TH+ cells in F. n = 3-4 each group. Data represent mean ± SEM, *P<0.05, **P<0.01, ***P<0.001.

