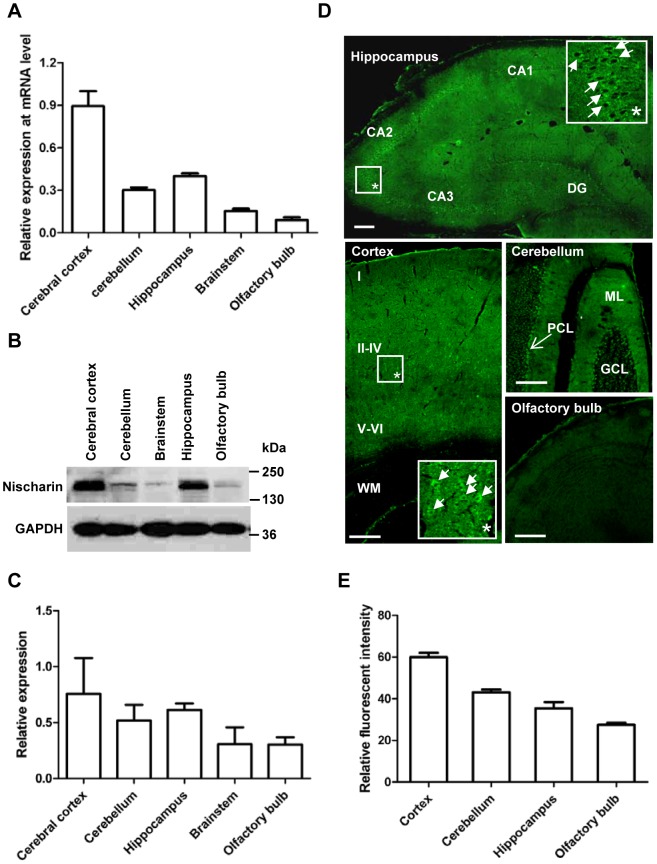
Figure 2. Regional distribution of Nischarin in the rat brain.
The highest expression level of Nischarin mRNA was in the cortex, based on real-time PCR (A). This was confirmed by Western blot analysis and immunostaining data at the protein level (B, C, E). Data are presented as mean ± SD. n = 5. The overview immunofluorescence images and the higher magnification images (*) revealed that Nischarin was clearly present in the pyramidal neurons of the cerebral cortex, the CA subfields of the hippocampus, and the Purkinje cells in the cerebellum (D). DG, dentate gyrus; ML, molecular layer; PCL, Purkinje cell layer; GCL, granule cell layer; WM, white matter. Scale bars, 200 μm. Images are representative of 3 rats.

