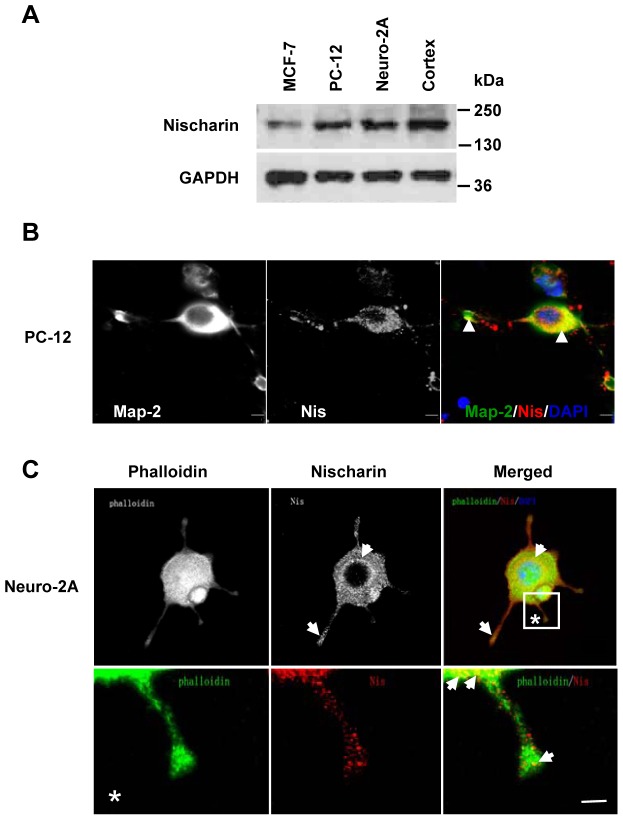
Figure 3. Subcellular expression pattern of Nischarin in neuronal cell lines.
(A) Western blot data revealed the expression of Nischarin protein in both PC-12 and Neuro-2a cells. MCF-7 cells and cortical tissue lysates were used as the positive controls (n = 5). (B) Immunofluorescent double-staining was performed to reveal the subcellular distribution of Nischarin in PC-12 cells. Co-localization of Nischarin (red) and Map-2 (green) was observed in the cytoplasm and dendrite-like projections (arrowheads in B). (C) The subcellular distribution of Nischarin was further confirmed by staining Neuro-2a cells with Nischarin antibody (red) and FITC-phalloidin (green). Strong staining for Nischarin in the perinuclear region and F-actin-rich protrusions (arrows in C) was observed on the overview and the higher magnification images (*). Scale bars, 5 μm.

