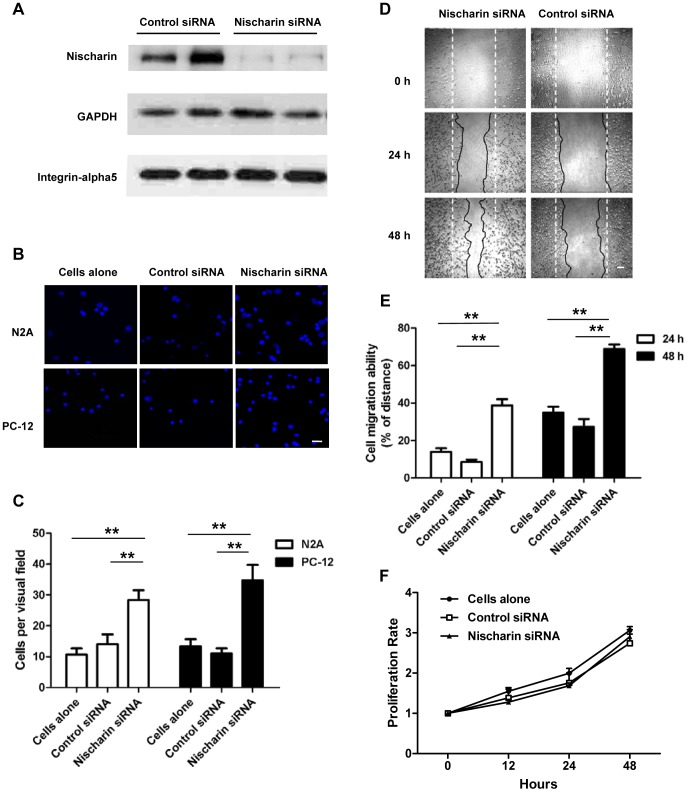
Figure 4. Knockdown of endogenous Nischarin promotes cell migration.
PC-12 and Neuro-2a cells were transfected with anti-Nischarin siRNA or control siRNA. (A) Immunoblot data showed that expression of endogenous Nischarin, but not that of integrin α5 was remarkably reduced at 48 h after transfection in Neuro-2a cells. (B) Cells migrating across the membrane of the transwell were stained with DAPI. Scale bar, 20 μm. (D) Images of migrated cells subjected to scratch assays. Scale bar, 100 μm. The dotted straight lines indicate the dimensions of the scratch, and the solid irregular lines indicate the cell edges. (C, E) Quantitative measurements of the motility indicated enhanced migration in cells transfected with anti-Nischarin siRNA compared with the control siRNA. (F) Proliferation rates of Neuro-2a cells are determined using MTT assay over 48 h. Data are presented as mean ± SD. n = 9/group. One-way ANOVA. *p<0.05, **p<0.01.

