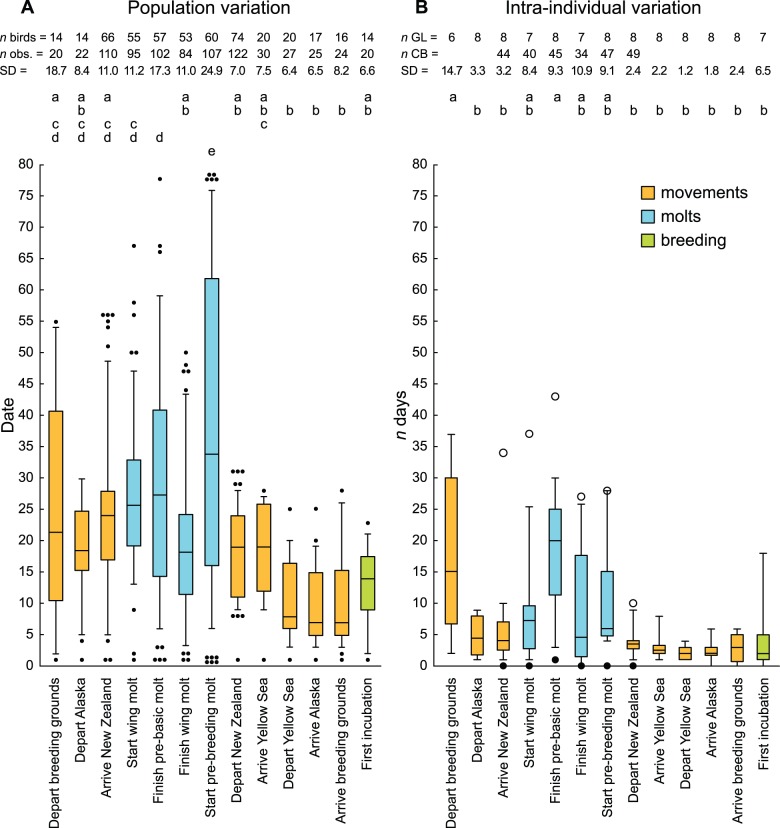
Figure 2. Population and individual variation in timing throughout the annual cycle of bar-tailed godwits.
Stages (x-axis) are in chronological order from left to right, starting with dispersal from breeding grounds (see Figure 1). (A) Distribution of all observations during March 2008–March 2010, standardized by date (day 1 = earliest observation for each stage). Data are derived from color-banded (New Zealand only) or geolocator-tracked (outside New Zealand) godwits. Boxplots indicate median and 25th and 75th percentiles; whiskers indicate 5th and 95th percentiles; filled circles indicate more extreme values; overlapping points are offset for clarity. Standard deviation (SD) is shown above. (B) Intra-individual variation in timing (difference between dates in successive years) for geolocator-tracked godwits (GL; sample sizes = individuals observed in two years). Boxplots indicate median and 25th and 75th percentiles; whiskers indicate entire range of values; SD is shown above. Circles indicate greatest (open) and least (filled) within-individual differences in the larger sample of color-banded (CB) birds (New Zealand only; sample sizes shown). Letters indicate significant differences in Kruskal-Wallis test followed by Dunn’s post-hoc comparison.

