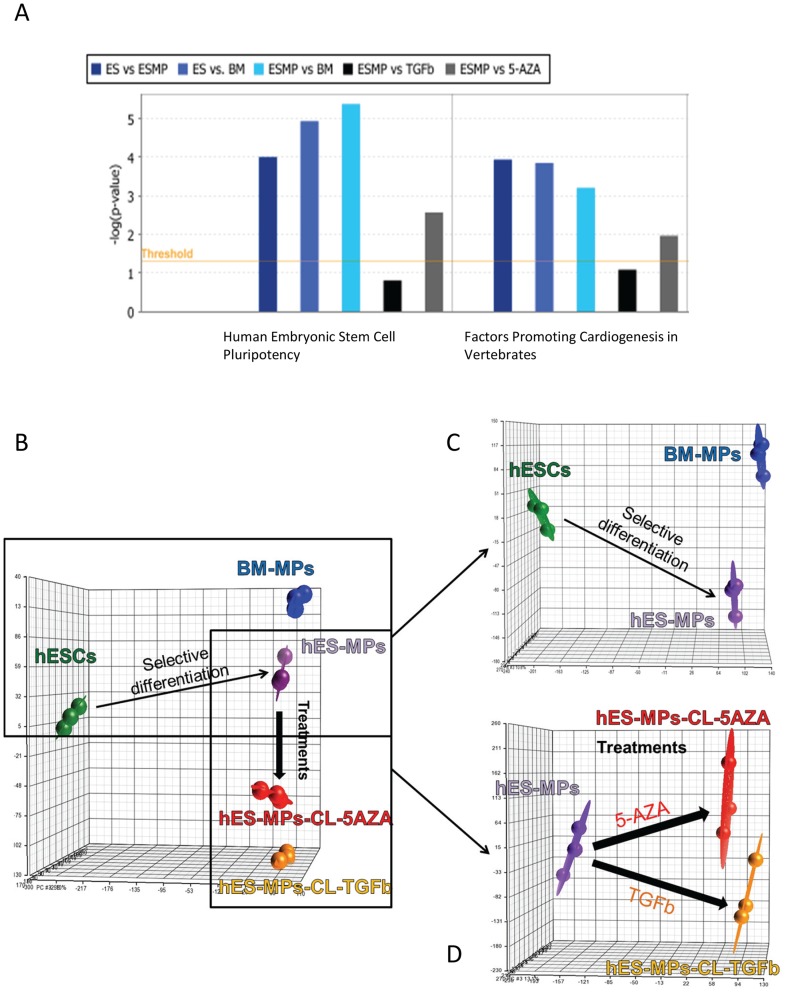
Figure 6. Transcriptomic comparison of hESCs, BM-MPs and hESC-MPs.
A. Pathway enrichment analysis (Ingenuity Pathway) of gene expression data shows the significance of gene expression changes between different differentiation states in two selected pathways. The threshold is set at a p-value of 0.05. B-D. Schematics of PCA analysis demonstrating the relationship between the different cell types.

