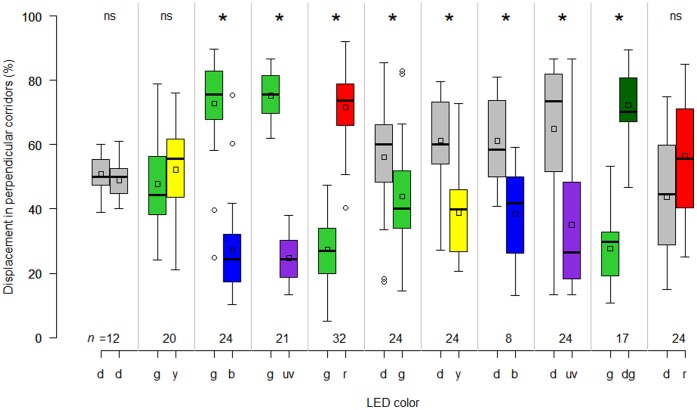
Figure 2. Orientation of weevils to colored lights in still air.
Walking response of Diaprepes abbreviatus adults exposed to colored LEDs in a multiple choice arena adapted to a servosphere expressed as percent displacement in perpendicular corridors. Relative displacement in the ‘x’ and ‘y’ corridors was compared to evaluate response during 3 minute runs when offered the choice between two different pairs of colored LED lights. Asterisks indicate significance (Wilcoxon signed rank test, α = 0.05), ‘ns’ is not significant and numbers on the horizontal axis are sample size, d = dark, y = yellow, g = green, b = blue, uv = ultraviolet, r = red, dg = dim green. Note that these experiments were performed in still air. In the boxplots, bold lines indicate medians, squares indicate the means, lower and upper boundaries of a box indicate the 25 and 75% quartiles, respectively, whiskers below and above the box indicate the 10th and 90th percentiles, respectively, and circles represent data beyond these limits (outliers).

