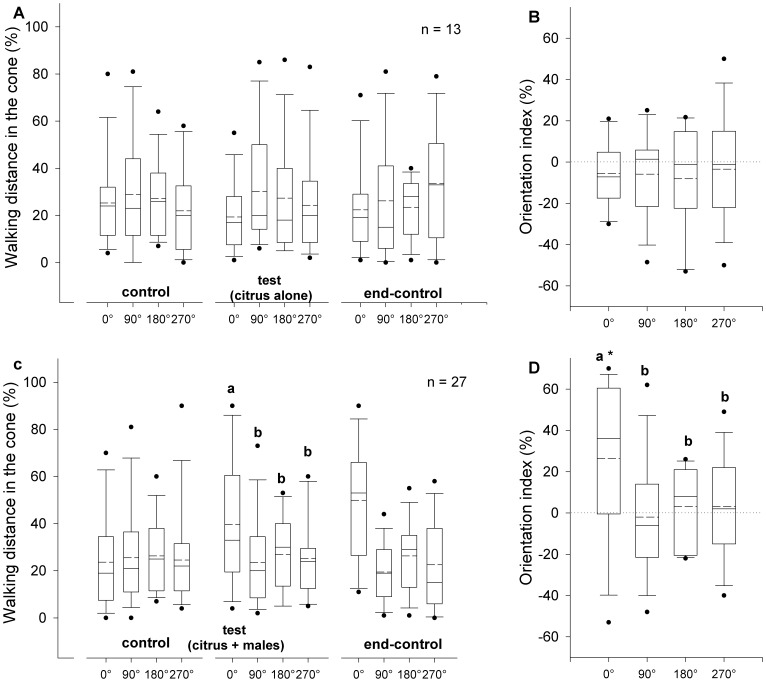
Figure 3. Orientation of weevils to citrus volatiles or volatiles produced by males feeding on citrus.
Orientation responses of Diaprepes abbreviatus adults, recorded during three consecutive 2-minute periods: A. clean air (control), air passing through headspace of citrus foliage (test) and clean air again (end-control), or C. control, air passing through headspace of 10 male weevils feeding on citrus foliage (test) and end-control, were expressed as percentage of distance covered in each of four 90° angles projected to 0°, 90°, 180° and 270°. Orientation indices (B. and D. respectively) were calculated as the proportion of distance covered during the test period minus the proportion of the distance covered during the control period in each angle. Different letters indicate significant pairwise differences across the different directions (α = 0.05, Dunn’s post-hoc test). Asterisk indicates significance (α = 0.05, Wilcoxon signed rank test). In the boxplots, bold lines indicate medians, segmented line indicate the means, lower and upper boundaries of a box indicate the 25 and 75% quartiles, respectively, whiskers below and above the box indicate the 10th and 90th percentiles, respectively, and circles represent data beyond these limits (outliers).

