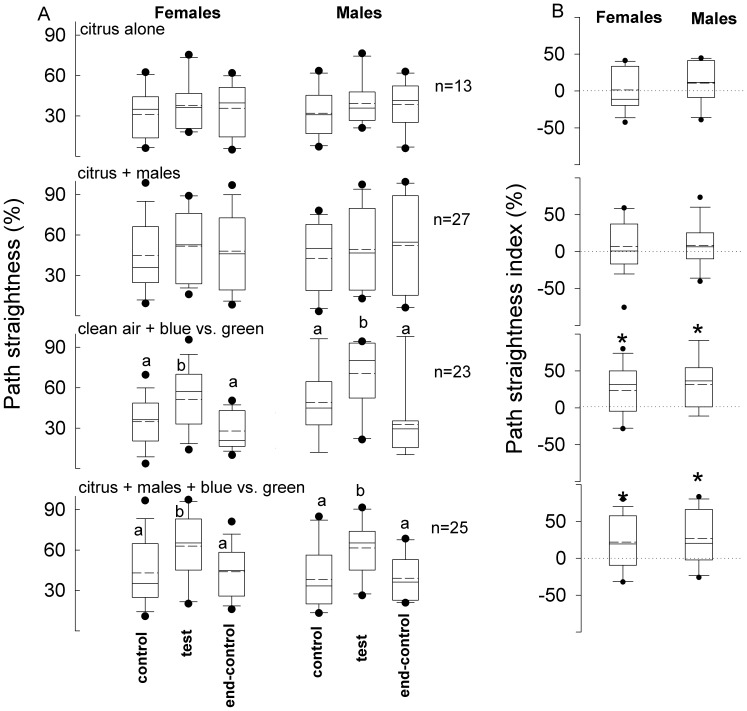
Figure 7. Path striaghtness of weevils elicited by different stimulus treatments.
A. Path straightness of Diaprepes abbreviatus females and males, exposed to different stimulus treatments , were recorded during the 3 three consecutive 2-minute periods (control, test and end-control). For treatments explanations see figure 5. B. Path straightness indices for each series were calculated as the average path straightness during the test period minus the average path straightness during the control period. Different letters indicate significant pairwise differences across the different directions (α = 0.05, Dunn’s post-hoc test). Asterisk indicates significance (α = 0.05, Wilcoxon signed rank test). In the boxplots, bold lines indicate medians, segmented line indicate the means, lower and upper boundaries of a box indicate the 25 and 75% quartiles, respectively, whiskers below and above the box indicate the 10th and 90th percentiles, respectively, and circles represent data beyond these limits (outliers).

