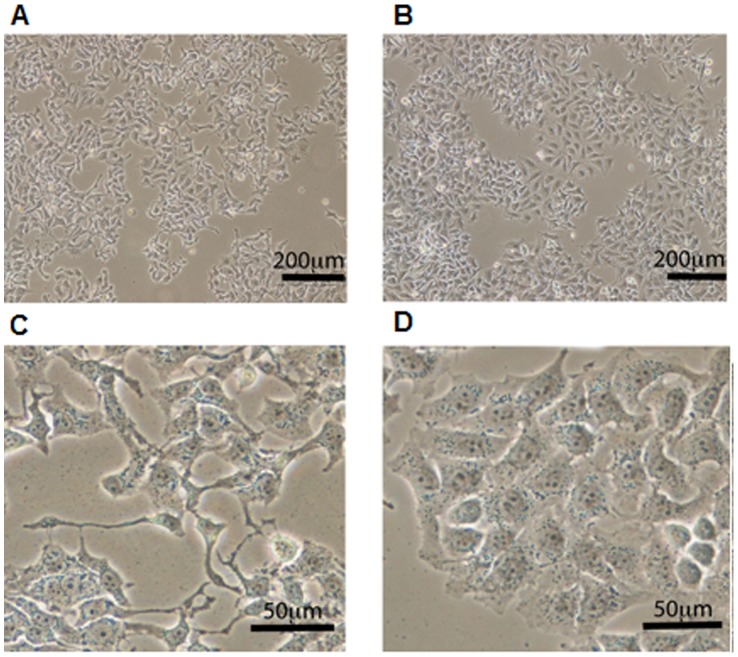
Figure 6. Effect of PS-modified SL2–B aptamer sequence compared to the scrambled sequence on Hep G2 cells.
Low magnification view of (A) modified sequence treatment, (B) scrambled sequence treatment on Hep G2 cells after 72 hours under hypoxia condition. Scale bar = 200 µm. Close up views of (C) modified sequence treatment, (D) scrambled sequence treatment on Hep G2 cells after 72 hours under hypoxia condition. Cellular morphology differs upon the different treatments; modified sequence treatment produces cells which are thinner with more cellular projections while the scrambled sequence treatment shows cells which appear closer to the untreated Hep G2 cells. Scale bar = 50 µm.

