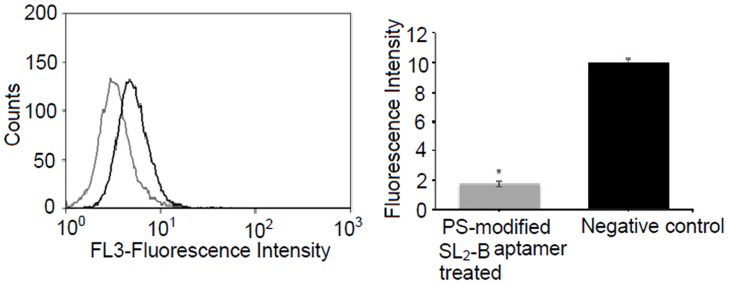
Figure 8. Flow cytometry histogram of Jagged-1 protein expression in Hep G2 cells using anti-human Jagged-1 antibody and quantitative analysis of flow cytometry result.

Each histogram curve represents the expression of Jagged-1 obtained with (gray line) and without (black line, negative control) treatment with PS-modified SL2-B aptamer at 15 µM concentration. *Significant difference from the negative control sample at p-value <0.05.
