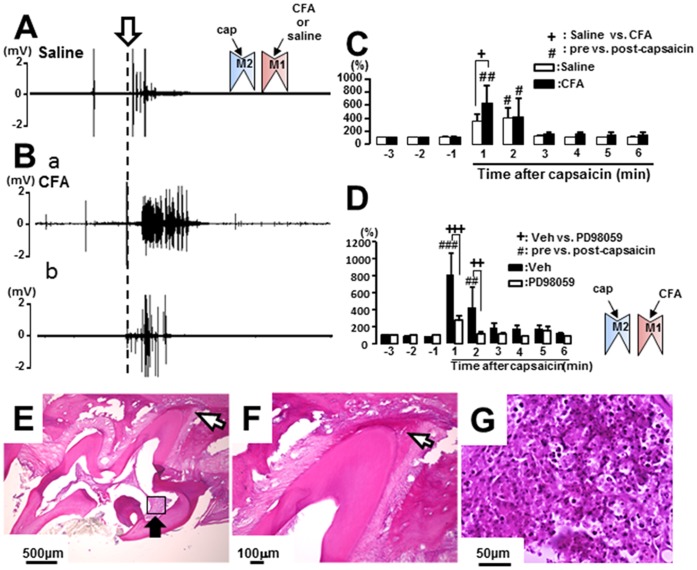
Figure 1. Masseter muscle activity following capsaicin application to M2 in the rats with M1 CFA-applied or saline-applied rats.
Typical examples of EMG activities recorded from the masseter muscle following capsaicin application to M2 in the rats with saline (A) or CFA (Ba: large response, Bb: small response) application to M1 on day 3 after the treatments. C and D: The mean area under the curve of integrated EMG following capsaicin application to M2 in M1 CFA- or saline-applied rats (C), and that following Veh- or PD98059-administration in the rats with M1 CFA application (D). E and F: Low (E) and high (F) magnification photomicrographs of CFA-applied M1 sections. G: High magnification photomicrograph of the area inidicated by the square box with the solid arrow in E. The open arrow in A indicates the timing of capsaicin application to M2. Open arrows in D and E indicate the apex of M1. The inset diagrams in A and D indicate the tooth pulp with drug application in this and following figures. CFA: complete Freund’s adjuvant, pre: before capsaicin application, post-capsaicin: after capsaicin application. +, # : p<0.05, ##: p<0.01.

