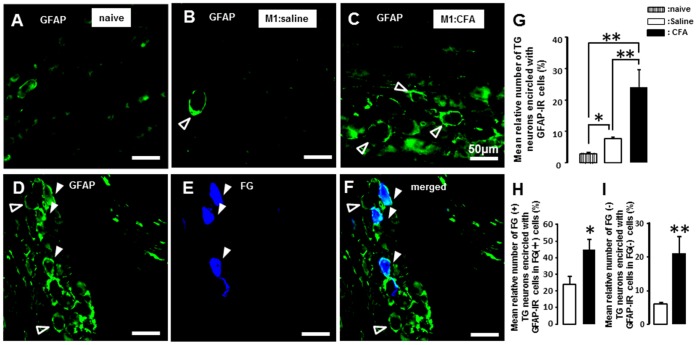
Figure 4. GFAP-IR cells in TG following capsaicin application to M2 in M1 CFA- or saline-applied rats.
A, B and C: GFAP-IR cells in naïve (A), M1 saline (B) or CFA-applied (C) rats. D: Photomicrograph of GFAP-IR cells (D), FG(+) cells (E) and FG(+) GFAP-IR cells (F) in TG. G: The mean relative number of TG neurons encircled with GFAP-IR cells (%). H: The mean relative number of FG(+) TG neurons encircled with GFAP-IR cells in FG(+) cells (%). I: The mean relative number of FG(–) TG neurons encircled with GFAP-IR cells in FG(–) cells (%). The open arrow heads indicate GFAP-IR cells. The white arrow heads indicate FG(+) cells encircled with GFAP-IR cells. *: p<0.05, **: p<0.01.

