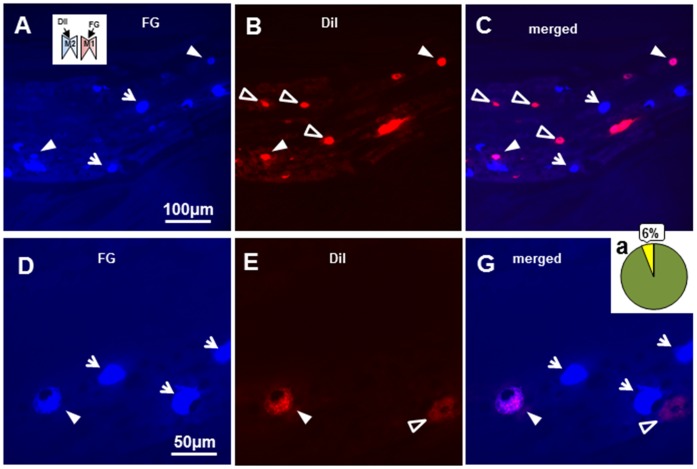
Figure 6. Photomicrographs and percentage of double retrograde tracing from M1 and M2 afferents to TG neurons.
A, B and C: Low magnification photomicrographs of FG(+) TG cells at 3 days after FG application to M1 (A) and DiI application to M2 (B), and the photomicrograph of A merged with B (C). D, E and F: High magnification photomicrographs of FG(+) TG cells 3 days after FG application to M1 (D) and DiI application to M2 (E), and the photomicrograph of E merged with F (F). Ga: Percentage of FG and DiI double-labeled TG cells indicated by the yellow pie. White arrow heads indicate FG and DiI double-labeled TG cells, the white arrows are FG(+) TG cells and open arrow heads are DiI(+) TG cells.

