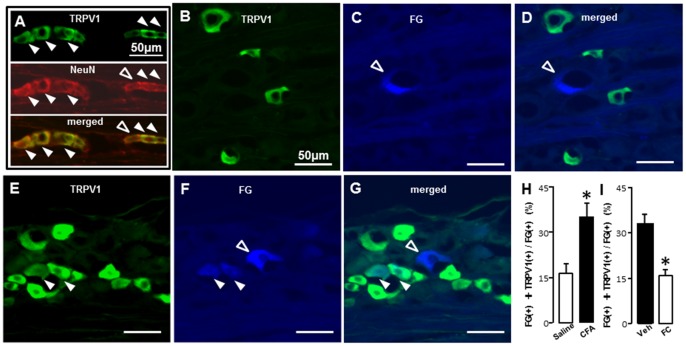
Figure 7. TRPV1-IR cells labeled with FG applied into M2 following CFA application to M1.
A: TRPV1-IR cells (upper panel), NeuN-IR cells (middle panel) and merged photomicrographs (lower panel) in M2 capsaicin-applied rats which received CFA to M1. B-G: FG(+) TG cells expressing TRPV1-IR in M1saline-adminstrated (B, C and D) and M1 CFA-administrated (E, F and G) rats. H: The mean number of FG(+) TRPV1-IR cells/FG (+) following saline (open bur) or CFA (solid bur) application to M1. I: The mean number of FG(+) TRPV1-IR cells/FG(+) following Veh (solid bur) or FC (open bur) injection into TG in M1 CFA rats. *: p<0.05.

