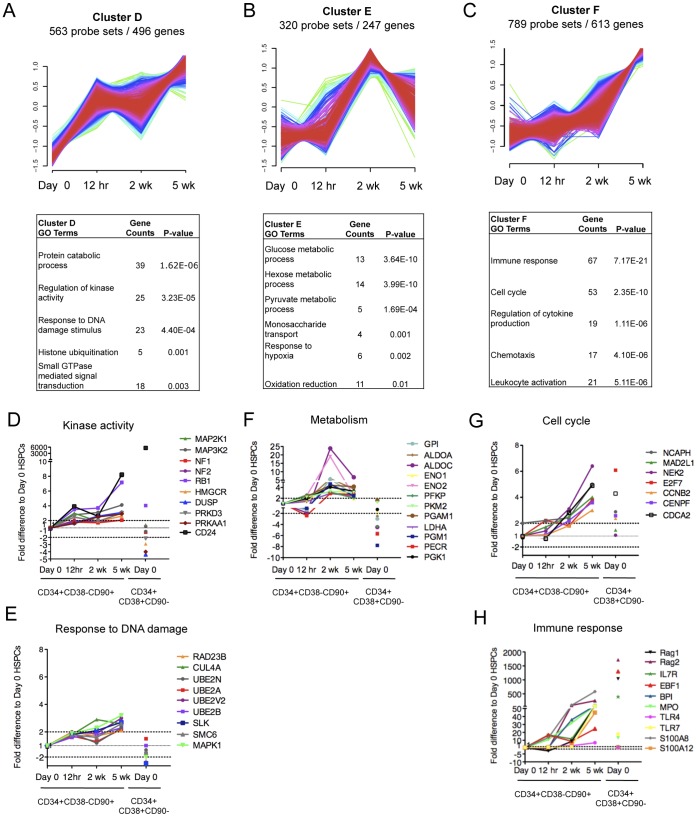
Figure 5. Ex vivo expanded CD34+CD38 −CD90+ cells show dynamic changes in transcriptional programs associated with cellular state.
Fuzzy C cluster analysis identified three temporal gene expression patterns describing genes that were either upregulated (A) immediately upon culture, (B) predominantly at 2 weeks of culture or (C) gradually during prolonged culture. The GO analysis of genes in (A), (B) and (C) is shown below each cluster respectively. The GO analysis from cluster D identified several genes associated with (D) Kinase activity and (E) response to DNA damage that were modestly upregulated during culture. (F) GO analysis from cluster E identified several genes regulating glucose metabolism. GO analysis of cluster F identified several genes associated with (G) Cell cycle and (H) Immune response that were upregulated during prolonged culture. Shown are fold difference in gene expression of CD34+CD38−CD90+ cells at each time point relative to Day 0 control CD34+CD38−CD90+ cells. CD34+CD38+CD90- indicates gene expression changes for differentiated progenitors relative to Day 0 control CD34+CD38−CD90+ cells.

