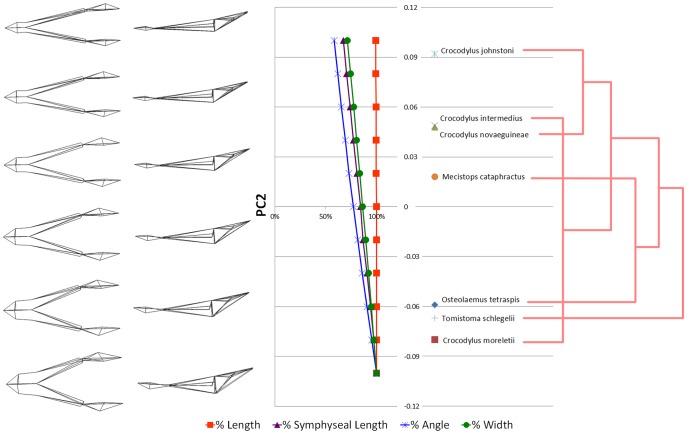
Figure 19. Quantification of Principal Component 2 (PC2).
Wireframe (left) of mandible from dorsal and lateral perspectives illustrates decreasing mandible robustness with increasing PC2 values. The chart in the centre shows the value of each morphological variable (e.g. symphyseal length) at a given PC value, as a percentage of the maximal value for that morphological variable. Specimens are plotted according to their respective PC2 values (centre right). Phylogram (right) shows poor correlation of specimen PC2 scores with phylogeny. Phylogeny based upon the results of Erickson and colleagues [47].

