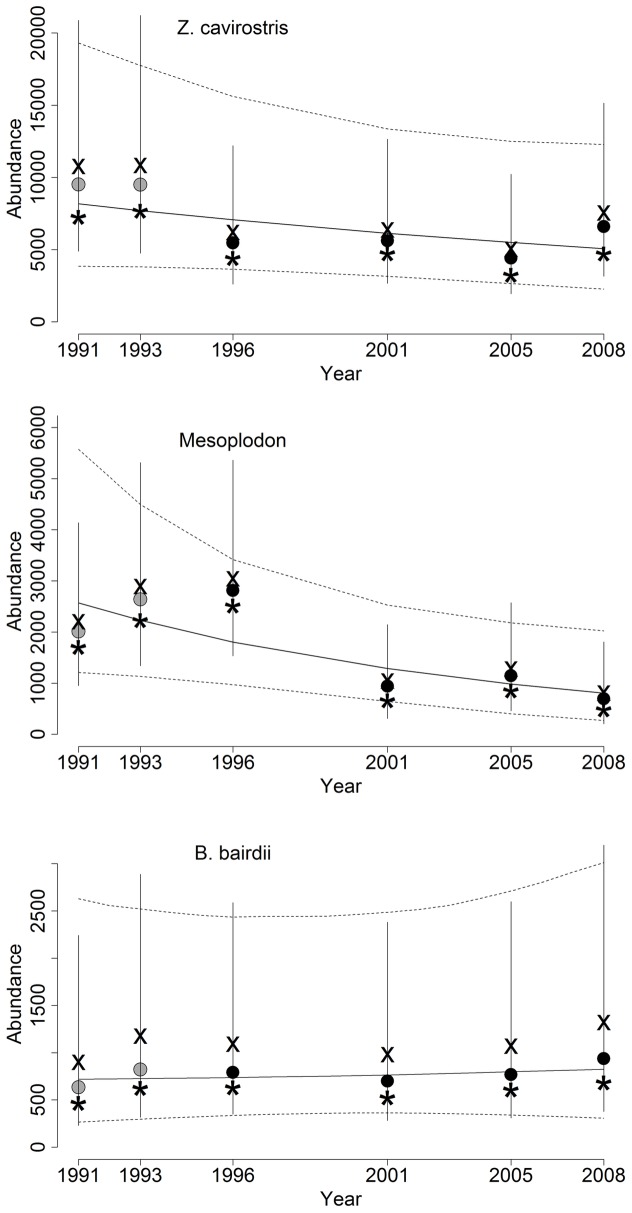
Figure 5. Abundance and trend estimates for beaked whales in the California Current, 1991–2008.
Z. cavirostris and Mesoplodon spp. estimates are pro-rated to include a proportion of the abundance estimated for the “unidentified ziphiid” group. For each year, the Bayesian posterior median (•), mean (X) and mode (*) abundance estimates are shown, along with 90% CRIs. Trend lines depict median and 90% CRI estimates of fitted abundance without process error (e.g., equation 1, with γt = 0). Gray points for median estimates in 1991 and 1993 denote that the total abundance estimate for the study area reflects extrapolated density estimates to the Oregon-Washington survey stratum.

