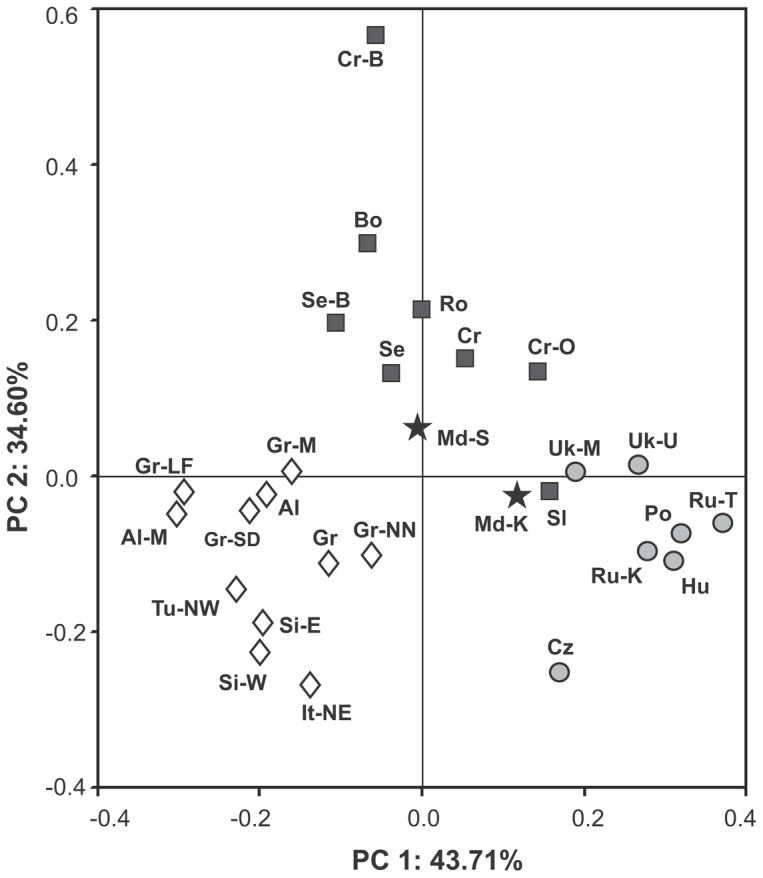
Figure 2. Principal Component Analysis (PCA) plot of Y chromosome haplogroup profiles showing genetic affinities among 28 populations from eastern, central and southern Europe.

Original references, number of samples and name codes for all populations included in the analysis and their haplogroup frequencies are listed in Table S1. Moldavian populations are indicated by stars; north Mediterranian groups by diamonds; eastern and central European populations including Ukrainians from Moldova by circles, and north Balkan groups including Romanians by squares.
