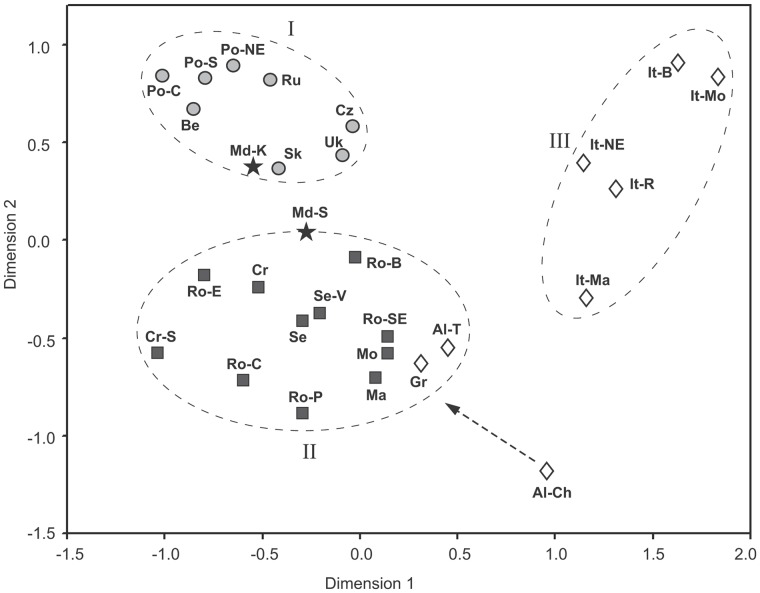
Figure 3. Multidimentional Scaling Analysis (MDS) plot of RST values from Y chromosome STR haplotype frequencies showing genetic affinities among 29 populations from eastern, central and southern Europe.
The stress value for the MDS plot is 0.056. Original references, number of samples and haplotypes and name codes for all populations included in the analysis are listed in Table S3. Symbol designations are as in Figure 2. The ellipses are drawn around the clusters of east/central European (eastern and western Slavic) (I), southeast European (Balkan-Carpathian) (II) and Italian (III) populations. While the Cheg Albanian population is a genetic “outlier” among southeast European populations, geographically it belongs in the Balkan-Carpathian cluster (indicated by an arrow).

