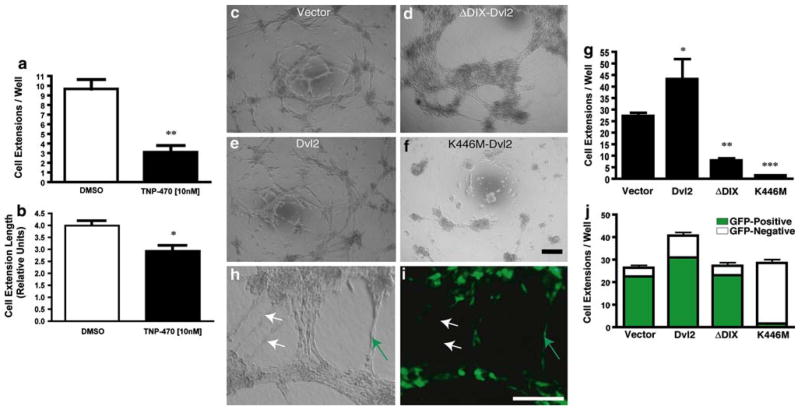
Fig. 5.
Both over-activation and inhibition of PCP signaling disrupt endothelial cell network formation. (a–b) TNP-470 inhibits the initiation of endothelial network formation in vitro. MPE cells were plated onto Matrigel™ with or without TNP-470. a The number of extensions formed was drastically reduced in the presence of 10-nM TNP-470. b Cell-extension length was reduced by approximately 25% with 10-nM TNP-470. c–f Networks formed by MPE cells expressing various Dvl2 constructs (as labeled). g Quantification of cellular extensions formed depicted in (c–f) (N = 8/group). h–j MPE cells co-expressing Dvl2 mutations and GFP were mixed with non-transfected MPE (mosaic analysis) and incubated on Matrigel™. h Phase contrast and i green fluorescence images of MPE cells within the mosaic analysis. Cell extensions were thereafter scored as GFP-positive (green arrows) or GFP-negative (white arrows) if cell extensions were devoid of GFP-positive cells. j Quantification of extensions formed in the mosaic analysis (N = 8/group). Values within each of the groups (GFP+ vs. GFP−) were statistically different (P <0.01). The non-mutant Dvl2 group displayed more extensive networks over other test conditions (P <0.05). The quantities were significantly different for the Dvl2-autonomous (increase, P <0.05) and K446M-Dvl2-autonomous (decrease, P <0.01) groups. All scale bars 200 μm

