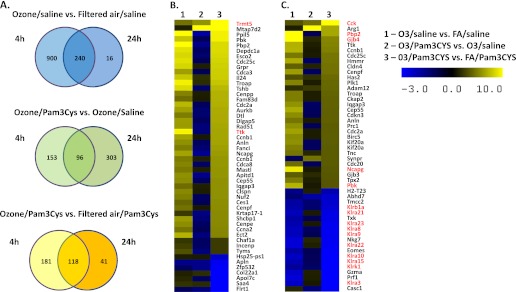
Figure 4.

Gene expression in lung tissue after ozone pre-exposure and intratracheal instillation of Pam3CYS. (A) Venn diagrams depict overlaps in expression profiles at 4 hours (28 h after ozone) and 24 hours (48 h after ozone) after Pam3CYS instillation. Differentially expressed genes were defined as those with a false discovery rate (FDR) of 5% and 2-fold change between the comparison groups at two time points. (B and C) Heat maps of the most differentially expressed genes as a result of ozone pre-exposure, followed by Pam3CYS treatment at the (B) 4-hour time point and (C) 24-hour time point. The heat maps depict the 50 most up-regulated and down-regulated genes in the O3/Pam3CYS versus FA/Pam3CYS comparison.
