Figure 1.
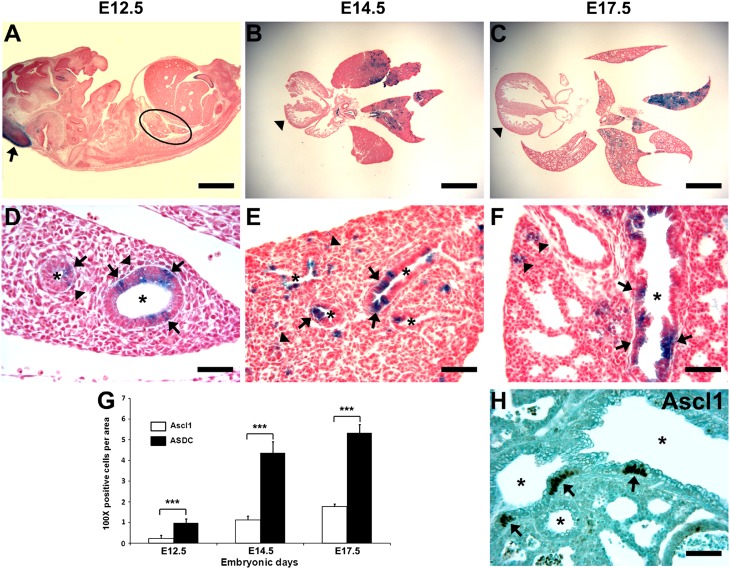
Distribution of Achaete–Scute homologue–1 (Ascl1) expression and of Ascl1-defined cells (ASDCs) in developing lung tissue. (A–F) Photomicrographs of ASDCs on Embryonic Day (E) 12.5, E14.5, and E17.5 during development from Ascl1-Cre;Rosa26R-lacZ mice. (A) E12.5. Whole embryo with blue in the developing midbrain (arrow). No blue cells are visible in the lung at this magnification (black ellipse). (B and C) Low-power view of lungs, with variable intensities of blue in different lobes. Heart is negative (arrowheads). (D and E) Epithelial staining along airway lining (arrows) and in parenchyma (arrowheads). (F) On E17.5, blue ASDCs are evident in the airway epithelium (arrows) and in the area of the alveolar sacs of the peripheral lung (arrowheads). X-Gal histochemical staining was performed with Nuclear Red. Asterisk indicates airway lumen. Magnification bars = 1,000 μm in A–C, and 50 μm in D–F. (G) Bar graph of Ascl1-positive pulmonary neuroendocrine cells (PNECs) and ASDCs in the developing lung (mean ± SE). The data reflect 3 mice/genotype. ***P < 0.001. (H) Ascl1 expression in lung on E17.5. Three strongly positive neuroepithelial bodies (NEBs; arrows) are evident in developing bronchioli, which are indicated by asterisks. Immunoperoxidase staining, bar = 50 μm.

