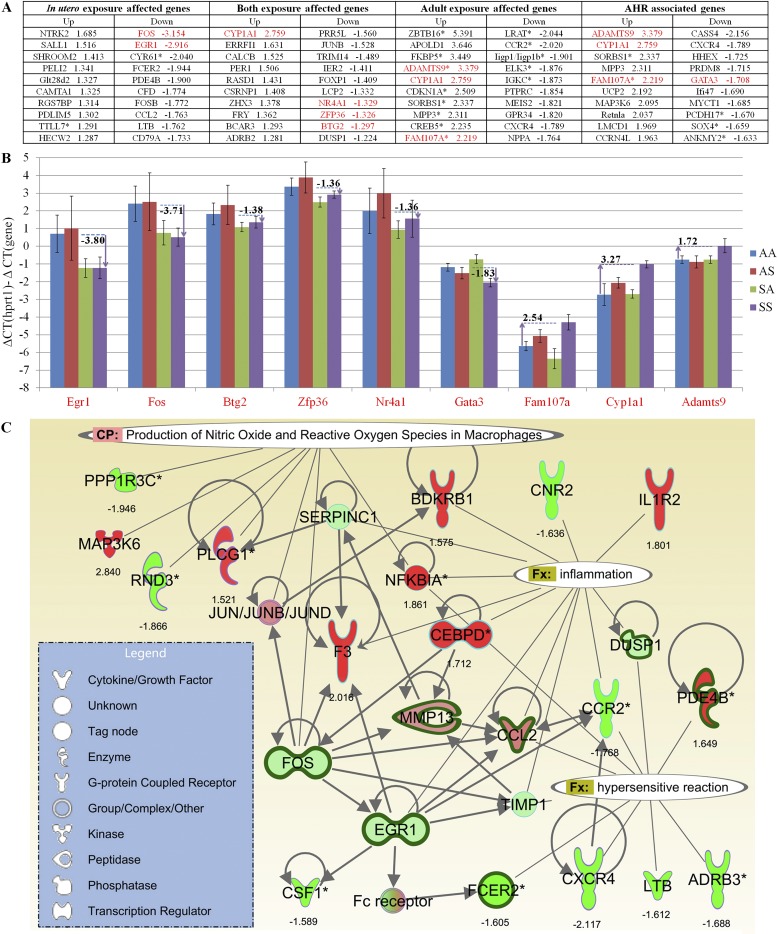
Figure 7.
(A) Microarray fold-changes between SS and AA (doubly exposed to SHS versus never exposed) are listed for the 10 most up-regulated/down-regulated genes in each of the four gene sets (in utero, adult, both, and AHR). Genes highlighted in red were confirmed by quantitative RT-PCR. (B) Quantitative RT-PCR, performed on nine genes, yielded comparable fold-change values (numbers shown for each gene) between SS (purple) and AA (blue), which confirmed the microarray-based findings. Data (y axis) are presented as differences in threshold cycle (−ΔΔCT) values, so that calculated values are positively associated with gene expression levels. For each comparison, the Hprt1 value is set at zero. (C) Genes affected by in utero exposure and those highly correlated with AHR were interconnected in IPA Pathway Designer, and were found to be significantly associated with several known biological functions and canonical pathways (P < 0.05). Thickened dark green edges indicate significant down-regulation attributable to in utero SHS exposure (SX versus AX); colors inside each node indicate gene expression changes with increased AHR (SS versus SA, red/green = up-regulation/down-regulation).

