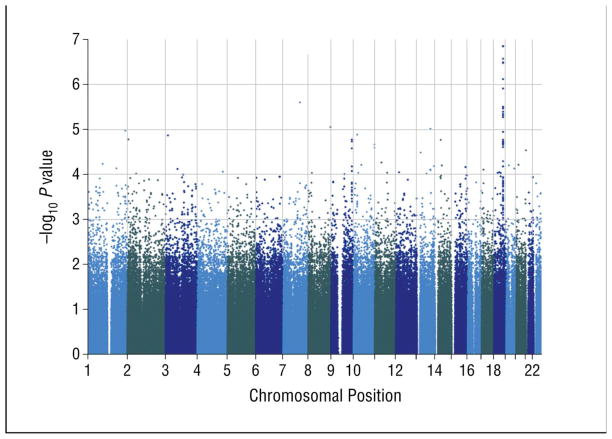
Figure 1.
A Manhattan plot from a genome-wide association study of antipsychotic-induced weight gain. Y-axis is the statistical significance levels (−log10 P values) of the association tests for each single nucleotide polymorphisms (SNP) and the phenotype (body mass index). Y-axis is the chromosomal position for all autosomal SNPs. Peak values are observed on chromosome 18, between positions 55.934 and 56.037 megabases (Mb). (Reprint from Malhotra et al.15)

