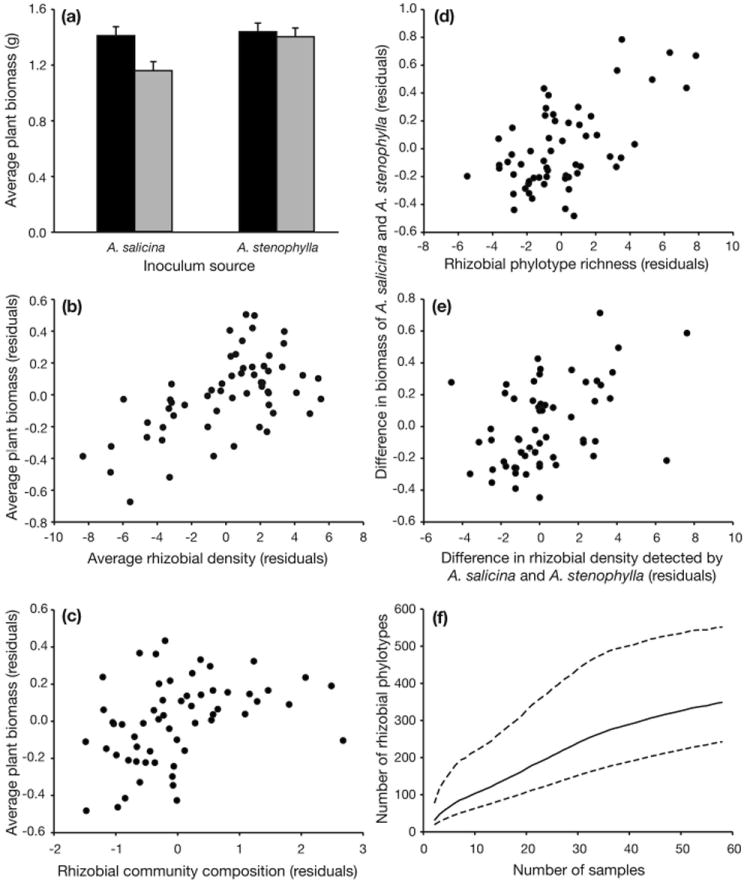
Fig. 2.

Fig 2a presents the growth of A. salicina (black bars) and A. stenophylla (grey bars) in soils sampled from A. salicina and A. stenophylla. On average, A. salicina and A. stenophylla growth increased with increasing rhizobial density (Fig. 2b) and values of the fifth principal component of rhizobial soil community composition (Fig. 2c). The difference in growth of A. salicina and A. stenophylla increased with phylotype richness of rhizobial communities (Fig. 2d) and with differences in rhizobial density measured by the two plant species (Fig. 2e). Figs. 2b-2e are partial regression plots which represent the slope and error after removal of other predictors in the best model. Fig. 2f presents the estimate and 95% CI for total phylotype diversity associated with A. salicina and A. stenophylla in southeastern Australia.
