
Figure 1.
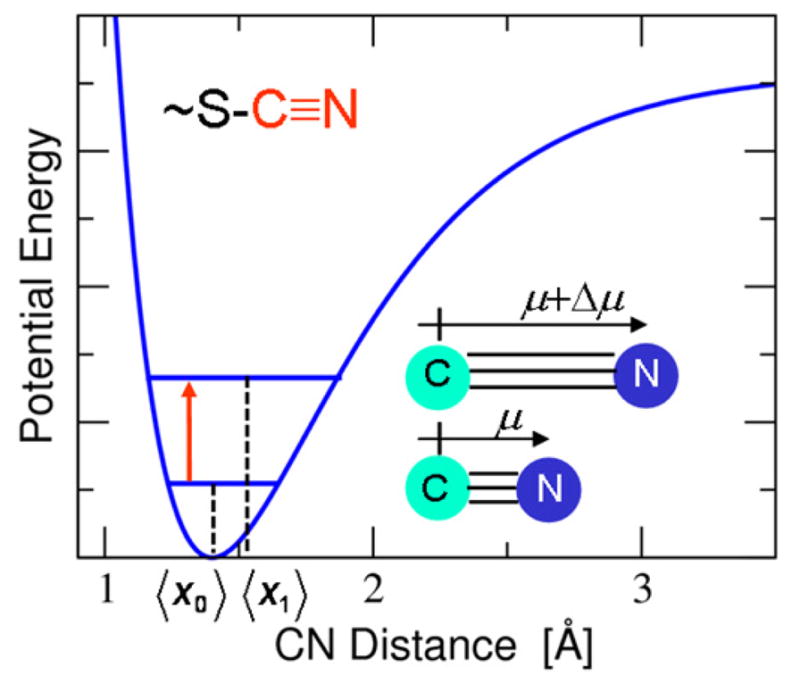
Schematic diagram of the one-dimensional potential energy curve as a function of the CN bond length and the corresponding ground and first excited vibrational state energy levels. The anharmonicity of this curve leads to different average CN bond lengths, where 〈x1〉 > 〈x0〉, and therefore different dipole moments, where 〈μ〉 > 0, associated with these two vibrational states. As a result, the CN vibrational frequency, indicated by the red arrow, is sensitive to the local electrostatic field, leading to the vibrational Stark effect. This figure was inspired by and modeled after Figure S1 in Ref. 6.