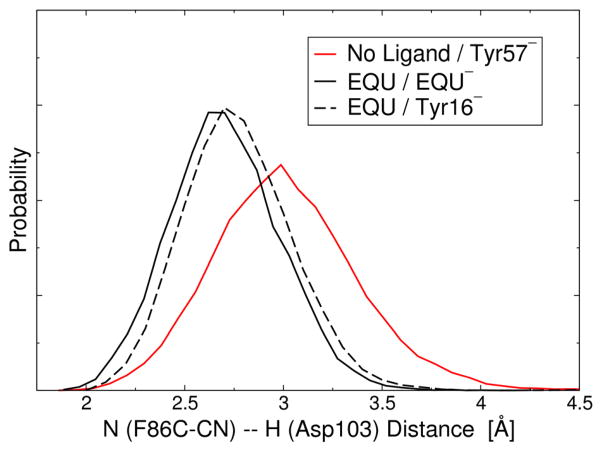
Figure 8.
Distribution of the distance between the amide hydrogen of the Asp103 backbone and the nitrogen of the F86C-CN probe as determined from the MD simulations of the F86C-CN D40N KSI system with no ligand bound and Tyr57 depronated (solid red line), with EQU bound in its anionic form (solid black line), and with EQU bound in its neutral form and Tyr16 deprotonated (dashed black line).

