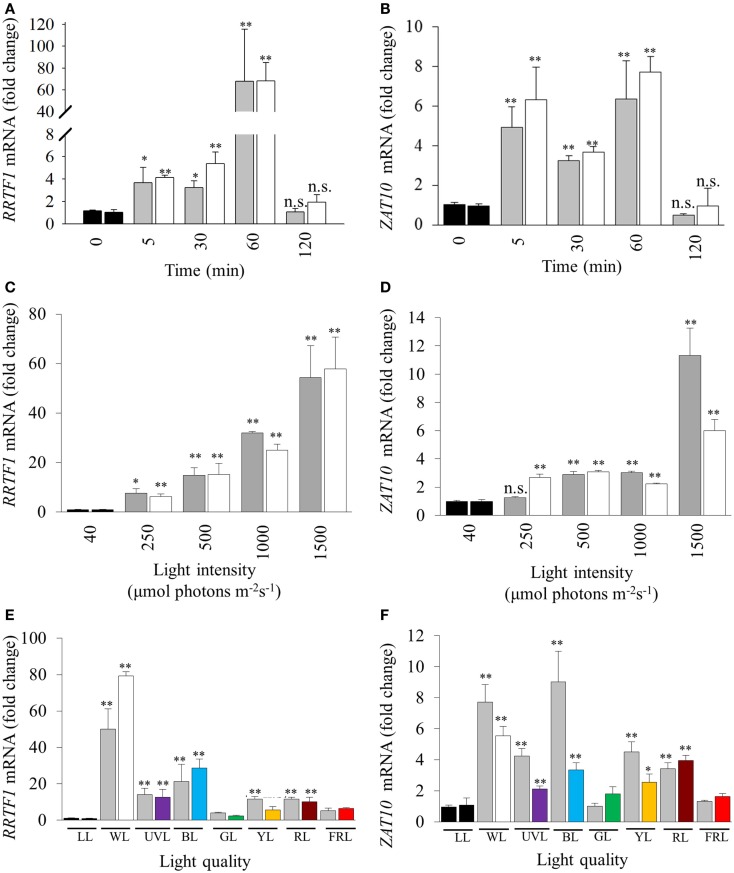
Figure 2.
Influence of duration, intensity, and quality of HL on SAA-mediated gene expression. (A), (C), and (E) RRTF1; (B), (D), and (F) ZAT10. LL (black bars, 40 ± 25 μmol photons m−2s−1), HL-treated leaves (white, 1500 ± 50 μmol photons m−2s−1), and distal leaves (grey). (A,B) Duration of HL (1500 μmol photons m−2 s−1) treatments after 0, 5, 30, 60, 120 min; (C,D) 60 min HL at 250, 500, 1000, and 1500 ± 50 μmol photons m−2s−1; (E,F) 60 min HL (1500 μmol photons m−2 s−1) using LEDs of different light qualities: LL control plants (black, LL), distal (grey), white HL (WL), ultra violet light (UVL), blue (BL), green (GL), yellow (YL), red (RL), and far-red (FRL). For each sample n = 6, *p < 0.005, **p < 0.001, n.s., not significant, error bars indicate standard error. LSD post hoc tests from one-way ANOVAs show that for both RRTF1 and ZAT10 plants under white and blue light LED treatments caused the significant SAA gene induction (P < 0.05). For spectral details, Section “Materials and Methods” and Figure 1.

