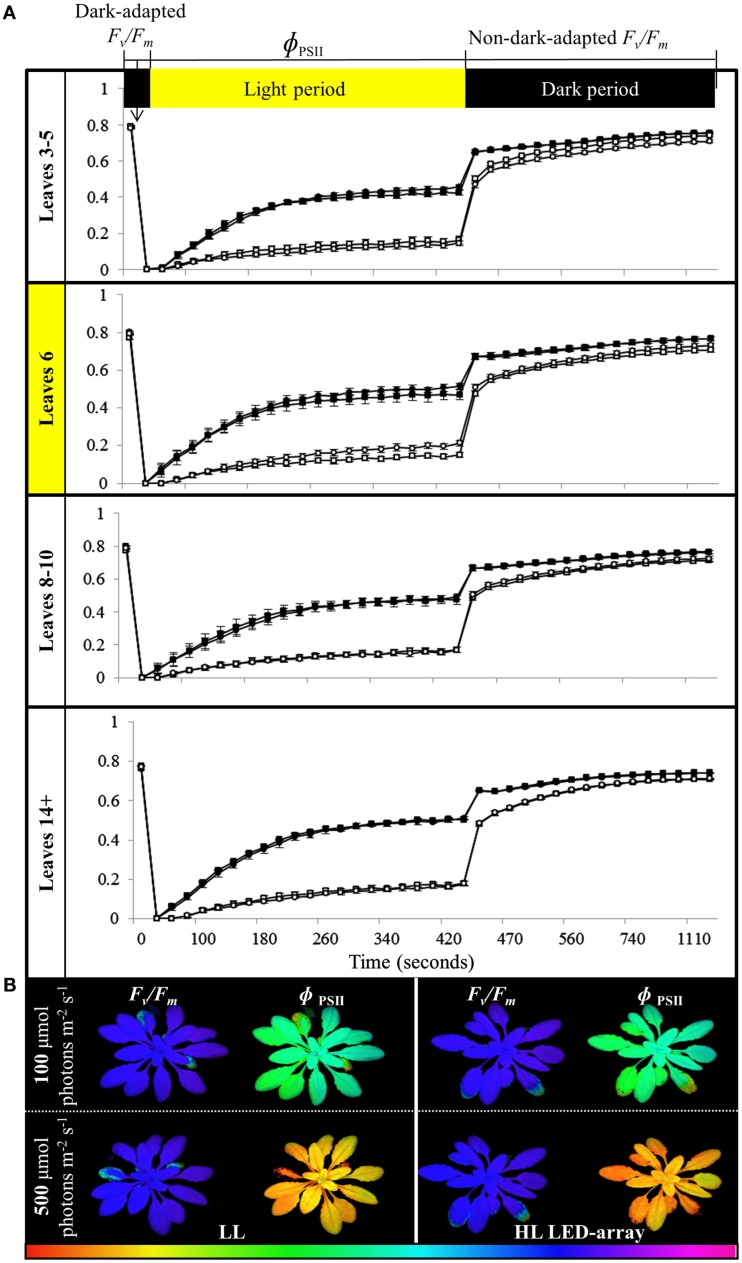
Figure 8.
Comparison of photoinhibition and recovery in plants after the repeated, transient HL SAA acclimation experiment exposed to 150 and 500 μmol photons m−2 s−1. Treated plants were subjected to three separate 1 h HL LED-spot treatments per day for 8 days prior to measurement. (A) Fv/Fm and ΦPSII measurements of both HL LED-array treated (circle) and untreated plants (square) subsequently exposed to either 150 (closed symbol) or 500 μmol photons m−2s−1 (open symbol) and dark for the indicated time are shown. The leaf position is indicated. The entire experiment was performed in triplicate, one representative is shown for which n = 3. (B) A representative false colour image of Fv/Fm and ΦPSII (measured at 420 s) from HL LED-array exposed (HL) and untreated (LL) plants under 100 and 500 μmol photons m−2s−1. The colored scale bar represents the corresponding value of ΦPSII or Fv/Fm, increasing in value from left (red) to right (pink).

