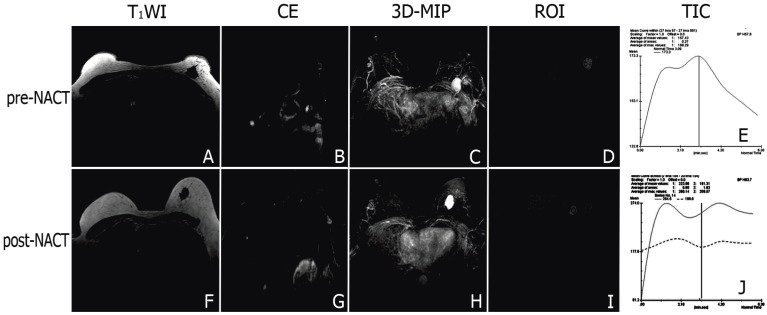
Figure 2.
Representative DCE-MR images of locally advanced breast cancers before and after NACT. Signal of the tumor and the swelling left axillary lymph node involved were markedly enhanced after contrast agent injected (A-B). 3D-MIP of contrast-enhanced T1-weighted images highlighted the irregular boundary of the tumor with marked enhancement and neovascularization around the tumor (C). The steep time-signal intensity curve suggested that contrast agents wash-in and wash-out the tumor quickly (D, E). After chemotherapy, the tumor and the swelling left axillary lymph node involved shrank (F, G), and the neovascularity reduced mildly (H). There was a platform appeared in the time-signal intensity curve when the signal of the tumor reached a peak (I, J).

