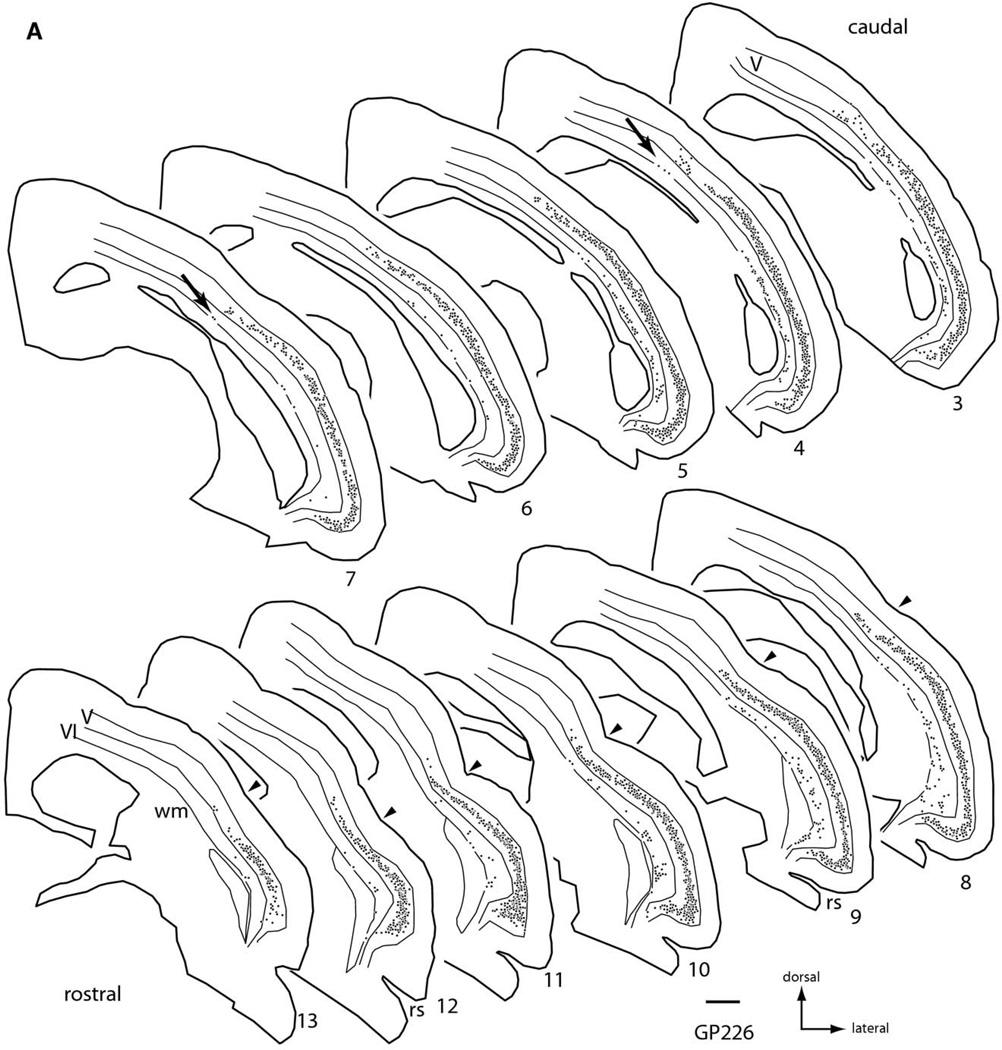
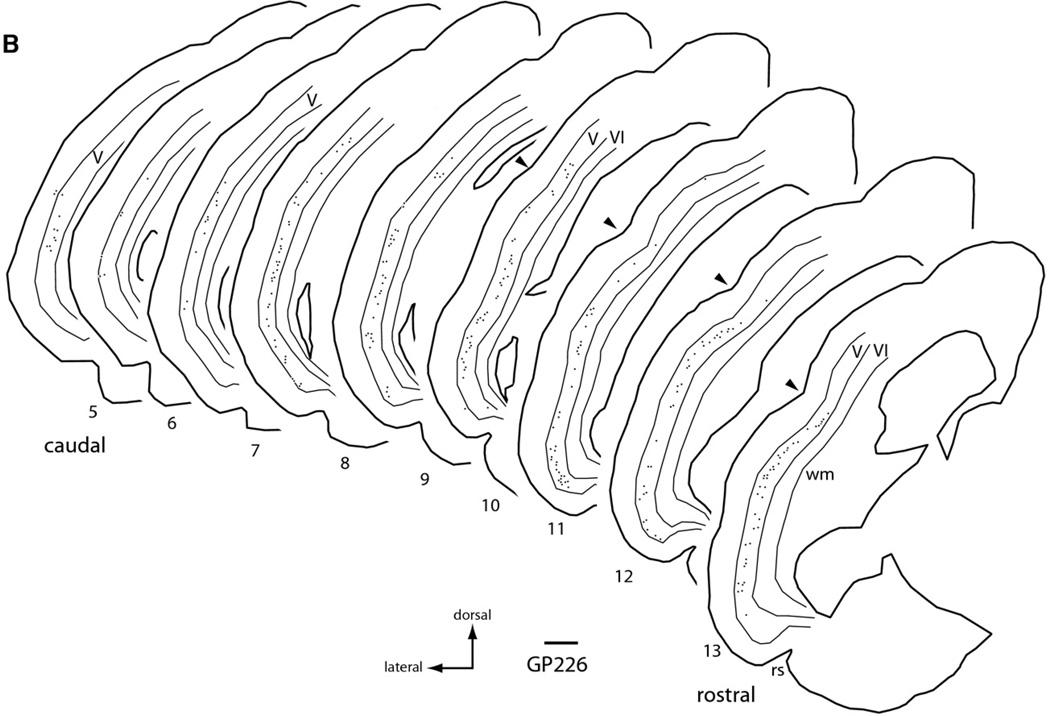
Fig. 2.
Plots of the distribution of FB-labeled cells in temporal cortex following a large injection of FB into the right IC (injection shown in Fig. 1). Plots are ipsilateral (A) or contralateral (B) to the injection. Each black dot represents one or more labeled cells. Sections are numbered from caudal to rostral and are spaced 600 µm apart. Scale bar=1 mm. Abbreviations: rs, rhinal sulcus; V, VI-cortical layers; wm, white matter; arrowheads, location of pseudosylvian sulcus; arrows, dorsally located layer VI cells.


