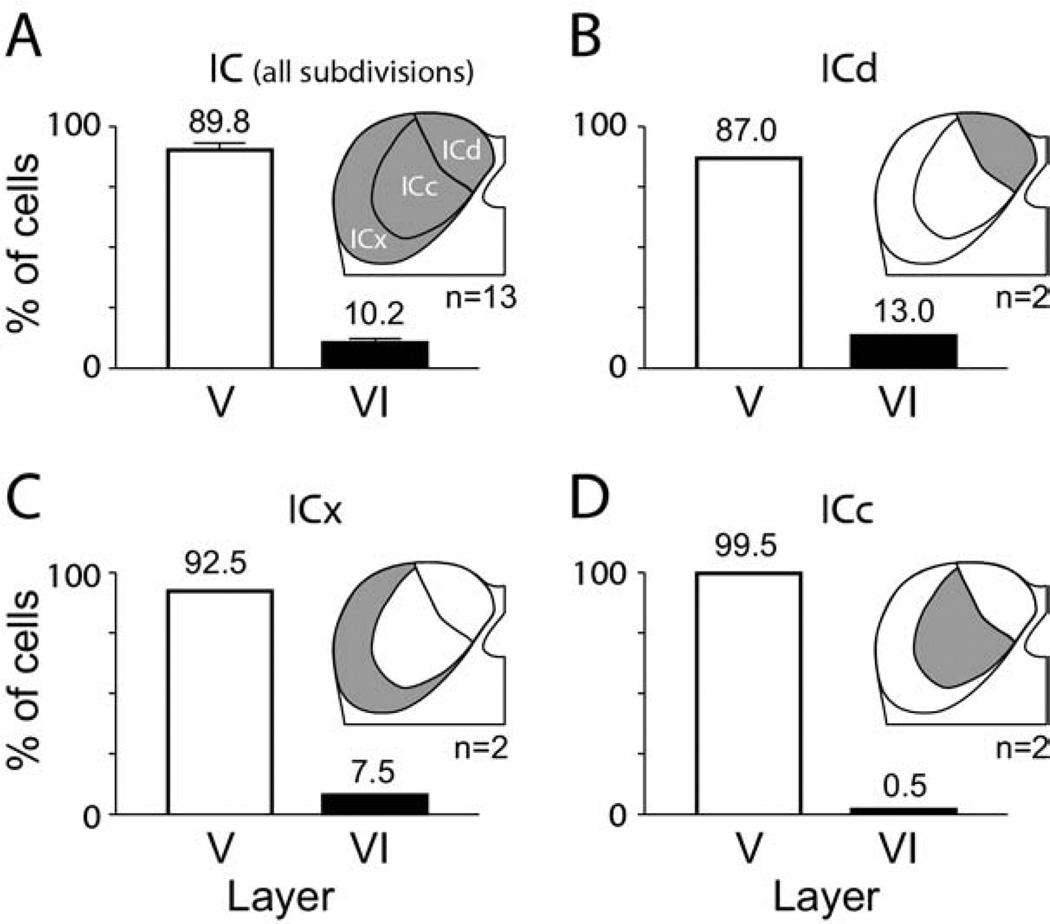
Fig. 7.
Graphs illustrating the relative number of cells in layer V (white bars) versus layer VI (black bars) labeled by injection of retrograde tracer into the ipsilateral IC. (A) Overview of projections to the entire IC (indicated by shading in the IC drawing) as revealed by pooling results across 13 experiments. Error bars indicate S.E.M. (B–D) Results from small injections restricted to the ICd (B), ICx (C) or ICc (D). For all panels: The numbers above each bar indicate the average percentage. n=Number of experiments.

