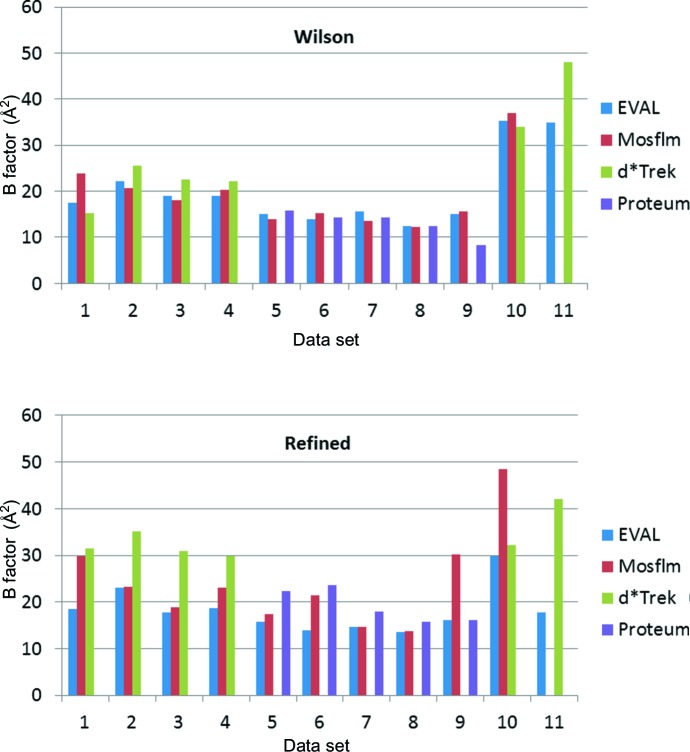
Figure 7.
Wilson diffraction data B factors (marked ‘Wilson’) and protein-model-refined average isotropic atomic B factors (marked ‘refined’) (Å2) for all 11 crystals. The last two crystals diffract to a lower, i.e. poorer, resolution. 1: 4dd0; 2: 4dd2; 3: 4dd3; 4: 4dd9; 5: 4dd1; 6: 4dd4; 7: 4dd6; 8: 4dd7; 9: 4ddc; 10: 4dda; 11: 4ddb.

