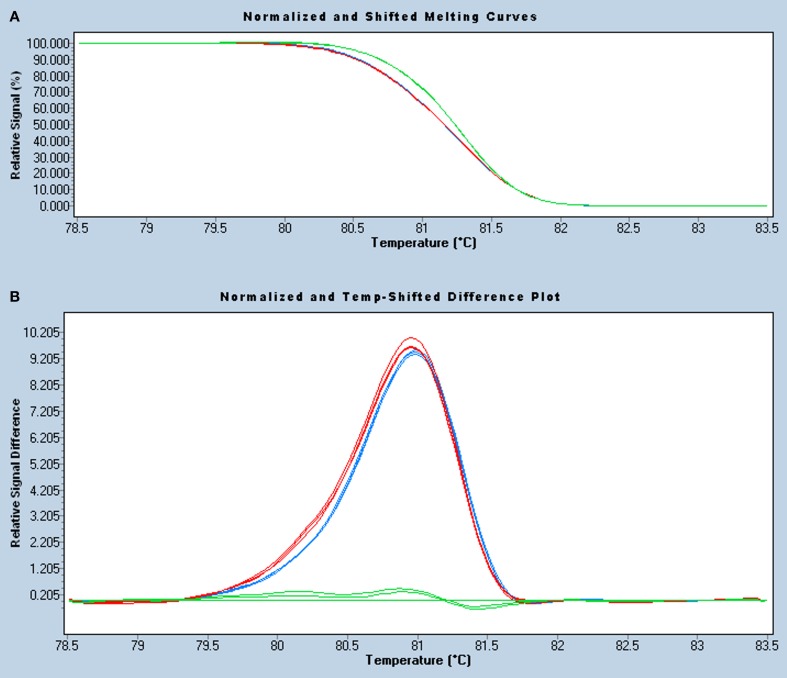
Figure 3.
HRM analysis of the DPYD c.1905+1G>A mutation in a 239-bp amplicon. Normalized and temperature-shift melting curves (A) and differential plot (B) of mutant homozygous (II.2, blue), heterozygous (III.2, red), and wild-type (II.5, green) samples, assayed in triplicate. As all samples were spiked with wild-type DNA, homozygous and heterozygous mutants show similar left-shifted melting curves and can be easily identified, especially in the differential plot.

