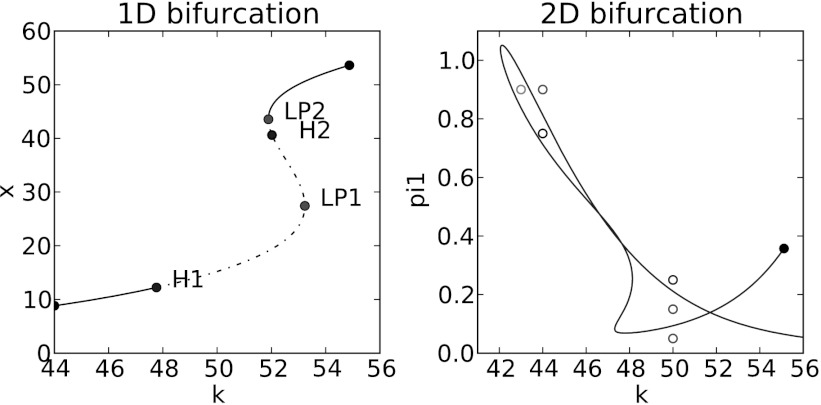
Fig. 4.
Bifurcation plots and sample trajectories for the reduced germinal center model. Left panel shows the 1D bifurcation plot as the separation k between DZ and LZ is varied. Oscillations arise as k is increased above the threshold labeled as H1 where a supercritical Hopf bifurcation occurs. The dotted line segment indicates the parameter range for k where the equilibrium solution is unstable and oscillations exist. At approximately k=52, a subcritical Hopf bifurcation occurs at H2. The equilibrium becomes stable again at the saddle node bifurcation LP2 and there are no oscillations beyond this value. It is also possible to go beyond single parameters and identify parameter combinations where bifurcations occur as illustrated by the right panel that shows the continuation of the Hopf bifurcation as k and the rate of synthesis of CXCR4 (π 1) are simultaneously varied. Fixed parameters: c=10, w=25, π 2=0.1, τ 1=0.06, τ 2=0.06, δ 1=0.006, δ 2=0.006, κ 1=1, κ 2=0.1, ϵ 1=0.3, ϵ 2=0.3, χ=28, ζ=1, γ=5. In the left panel, π 1=0.15, while in the right panel, the cyan (k=43, π 1=0.9), black (k=44, π 1=0.75), and green (k=50, π 1=0.15) circles represent (k, π 1) pairs that have oscillatory behavior, while the magenta (k=44, π 1=0.9), blue (k=50, π 1=0.25), and red (k=50, π 1=0.05) circles represent (k, π 1) pairs that have steady state solutions. In particular, the green circle (k=50, π 1=0.15) corresponds to a solution in the unstable equilibrium region of the left panel, where oscillatory behavior is predicted. Sample trajectories corresponding to these parameter pairs are shown in Fig. 7 (Color figure online)

