
Figure 10. H2O2 enhanced TG-mediated changes in [Ca2+]i of HAECs.
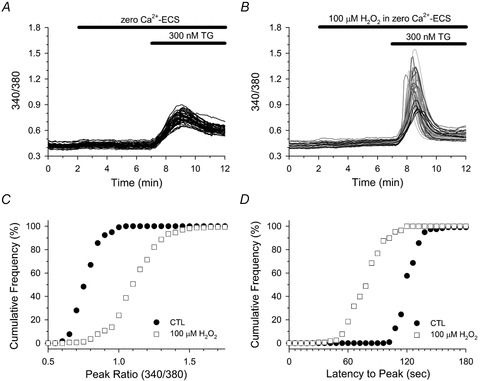
Fura-2-loaded HAECs in zero Ca2+-ECS were left untreated (A), or treated with 100 μm H2O2 (B) for 5 min immediately prior to challenging with 300 nm TG. A and B, individual cell traces are segregated into two phenotypic profiles as described in the legend of Fig. 5. C and D, cumulative frequency analysis of the peak ratio (C) and the latency to peak (D) in response to TG in control (filled circles) and H2O2 (open squares) treated cells. A total of 118 (control) and 168 (H2O2) cells were analysed from 3–4 experiments for each experimental condition. C and D, the TG-induced peak ratio and latency to peak of H2O2-treated cells was significantly different from untreated controls; P < 0.001.