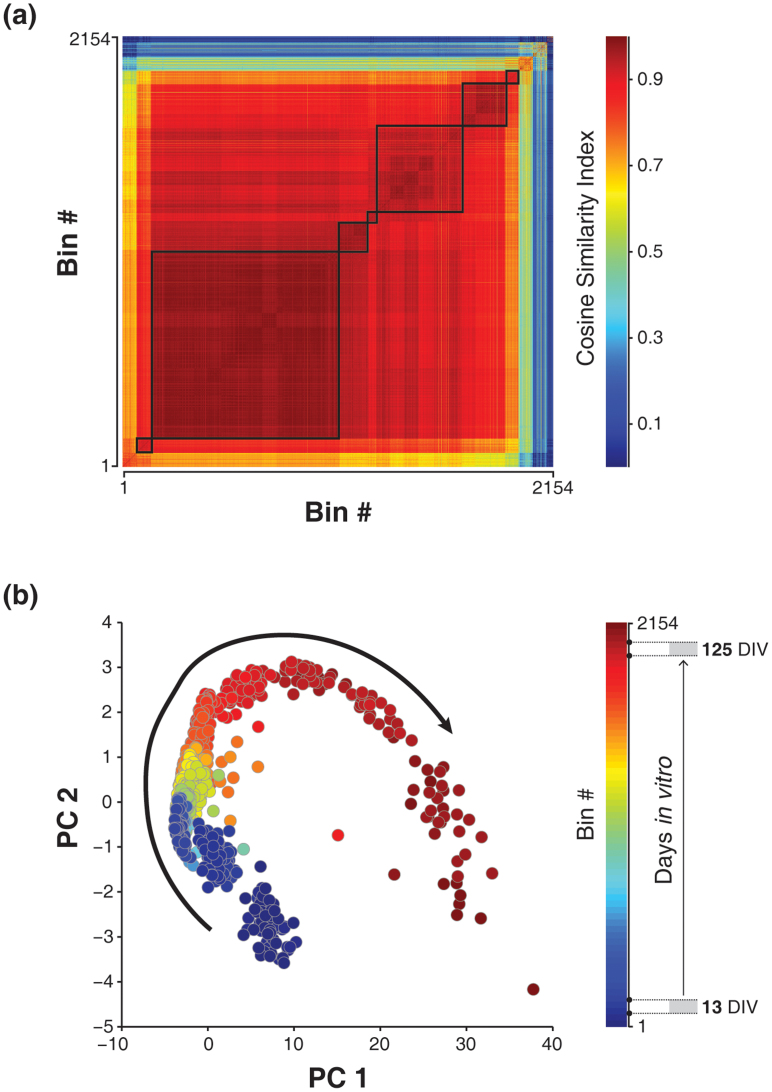
Figure 1. Unidirectional sequence of network state transitions during in vitro maturation.
(a), Similarity matrix of spatiotemporal firing patterns of a developing network. The colorbar indicates the range of similarity index. (b), Data in the PC coordinate shows a trail of clusters sequentially emerged through stages of development. The colorbar indicates the range of recorded life span. The arrow indicates the direction of sequential state transitions during development. DIV: days in vitro.

