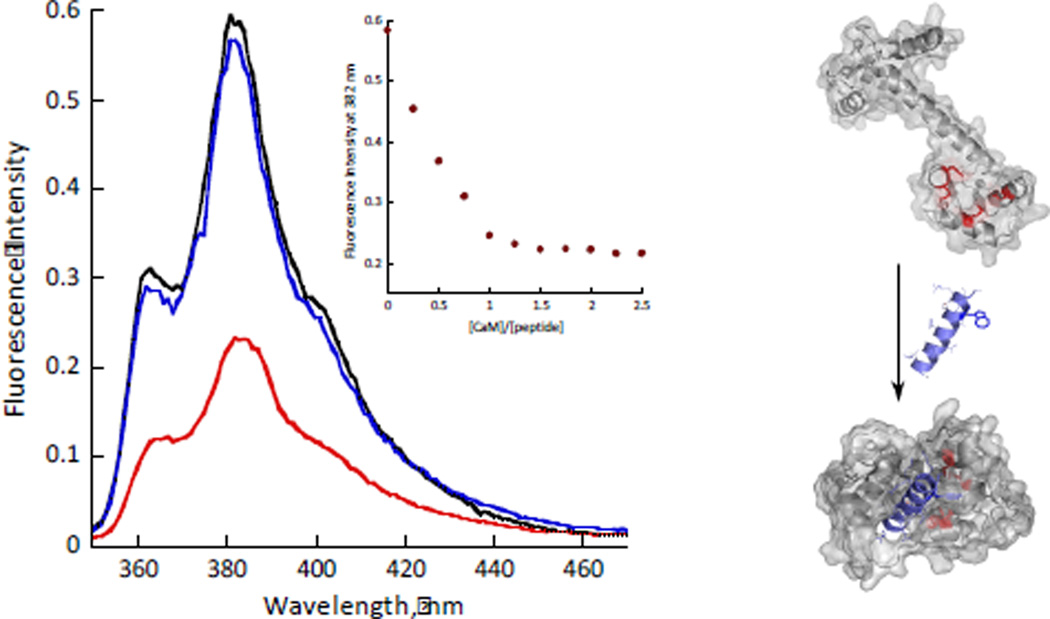
Fig. 2.
Left - Fluorescence emission spectra (λex = 342 nm) of smMLCK peptide (10 µM peptide, 50 mM HEPES, pH 7, 100 mM NaCl) before (black), after (red) addition of 12 µM of CaM and after addition of 2 mM EDTA (blue). The inset shows the corresponding titration curve. Right – A schematic representation of CaM-smMLCK interaction (respective PDB entries: 1cll and 2o5g). Met residues near AzAla are shown in red.

