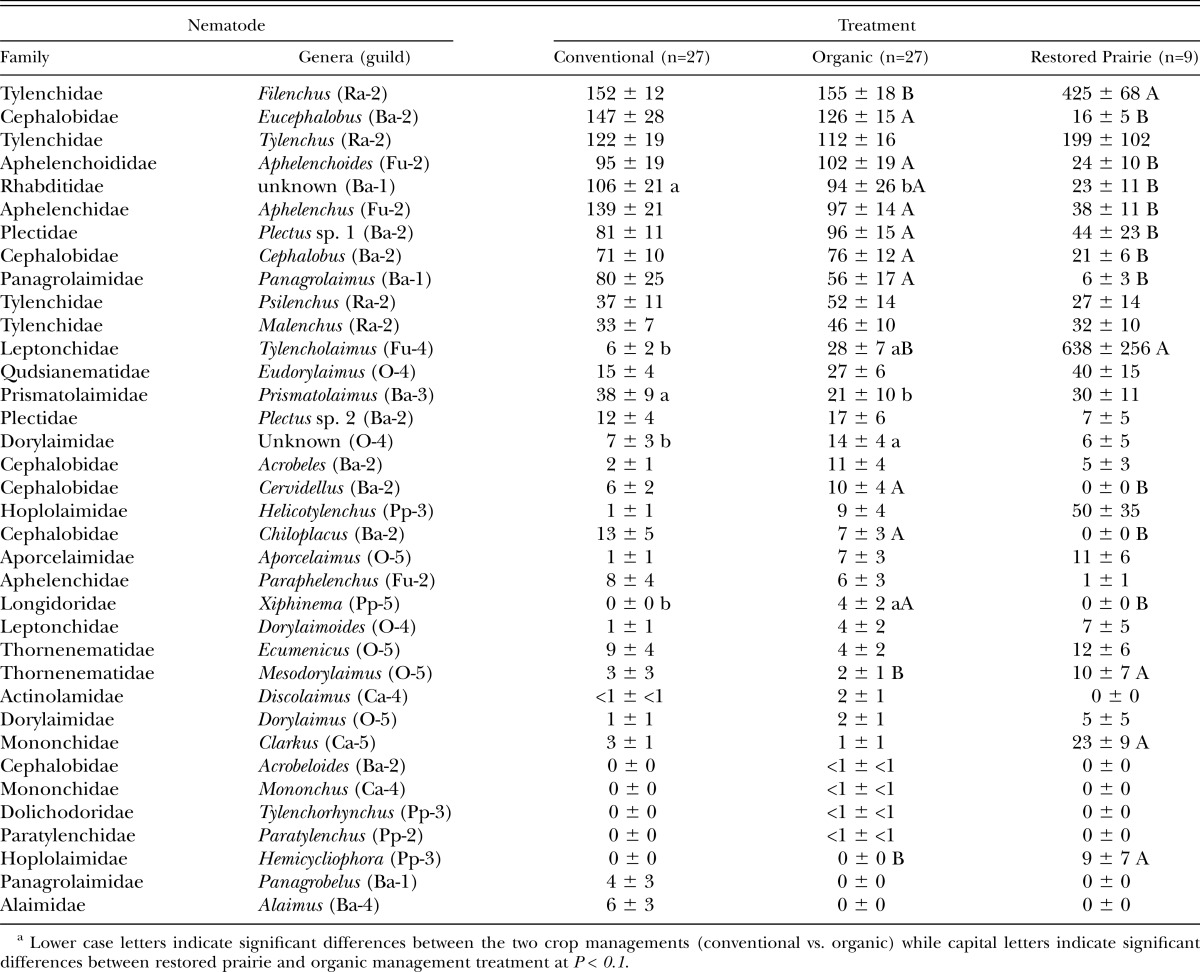
Table 1.
Mean abundancea (±1SE) of nematode individuals (per 100 g dry soil) for three sample occasions for the crop managements and restored prairie treatment. Values for conventional and organic managements are for across the three crop rotations. See text for guild descriptions.

