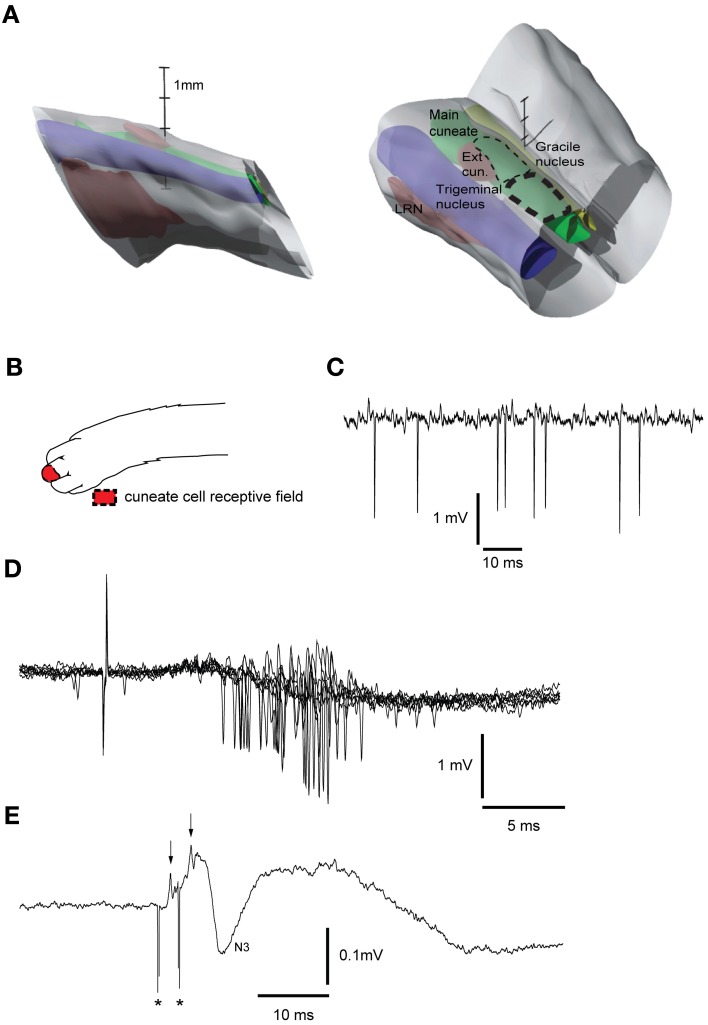
Figure 2.
Reconstruction of brainstem recording/stimulation site and sample recordings. (A) 3D reconstruction of the brainstem recording/stimulation sites. Thick dashed line represents the primary recording/stimulation area of the main cuneate nucleus. Thin dashed line shows the rostral extent of the recordings. LRN, Lateral reticular nucleus. Vertical scale bar tics: 1 mm. (B) Receptive field of cuneate cell recorded in (C). (C) Sample recording showing spontaneous cuneate cell activity. (D) Cuneate cell responses to electrical skin stimulation (1 pulse, 2 mA). (E) Response to electrical stimulation (2 pulses, 20 μA, 333 Hz) in the cuneate nucleus recorded on the surface of the cerebellar cortex. Asterisks indicate shock artifacts. Arrows indicate the afferent nerve volleys elicited by the stimulation. N3 field potential, [an indicator of activity in the parallel fiber synapses of the cerebellar cortex (Bengtsson and Jorntell, 2007)].

