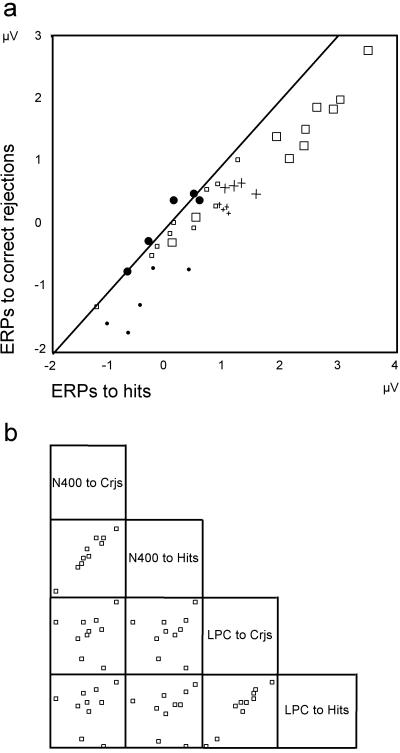
Figure 2.
(a) ERPs elicited by hits and correct rejections are contrasted for the 10 university students (▫ and □), Jon's two controls (+ and +, four measurements), and Jon (• and ●, five measurements). In each group, large symbols indicate the mean amplitude of the LPC measured between 500 and 700 ms after word onset over eight centroparietal electrodes, and small symbols indicate the mean N400 amplitude measured over eight frontocentral electrodes between 300 and 500 ms after stimulus onset (all data sets are transformed into a common average reference). On the black diagonal line, ERPs to hits and correct rejections are isoelectric. Jon's LPCs to hits and correct rejections (●) are all close to the isoelectric line, whereas all those of his two controls and of the 10 university students are more positive for hits than for correct rejections. (b) Mean LPC and N400 amplitudes elicited by correct rejections (Crjs) and hits are contrasted for the 10 university students. Although there is a high correlation between ERPs elicited by correct rejections and hits within the N400 and the LPC, there is no cross-correlation between the two.

