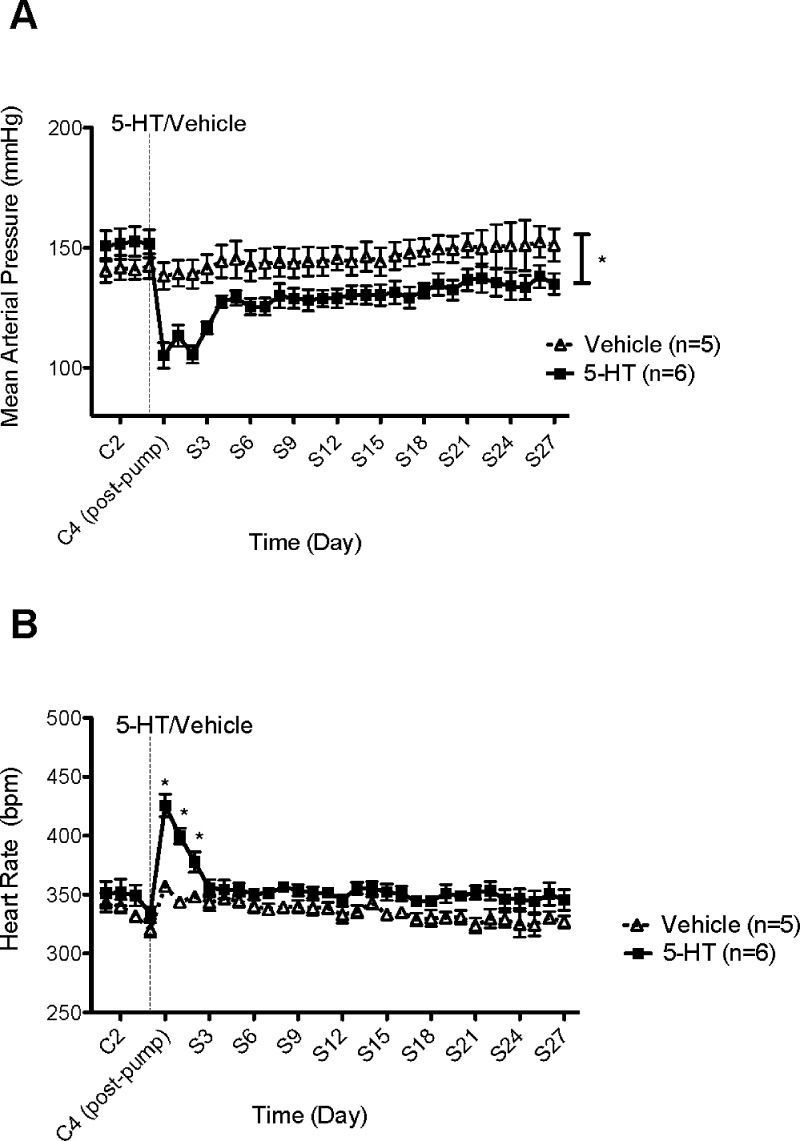
Figure 2.
(A) Effect of chronic 5-HT or vehicle infusion on mean arterial pressure (MAP) in established DOCA-salt hypertensive rats. Data points indicate 24 h averaged MAP ± SEM for the number of animals in parentheses. The vertical line denotes 5-HT or vehicle osmotic pump implant. Time is represented by days on the x-axis. C represents control recordings. S represents 5-HT/vehicle infusions. (B) Effect of chronic 5-HT or vehicle infusion on heart rate (HR) in established DOCA-salt hypertensive rats. Data points indicate 24 h averaged HR (bpm) ± SEM for the number of animals in parentheses. The vertical line denotes 5-HT or vehicle osmotic pump implant. Time is represented by days on the x-axis. C represents control recordings. S represents 5-HT/vehicle infusions. *Statistically significant difference (p < 0.05) vs vehicle.

