
Figure 3.
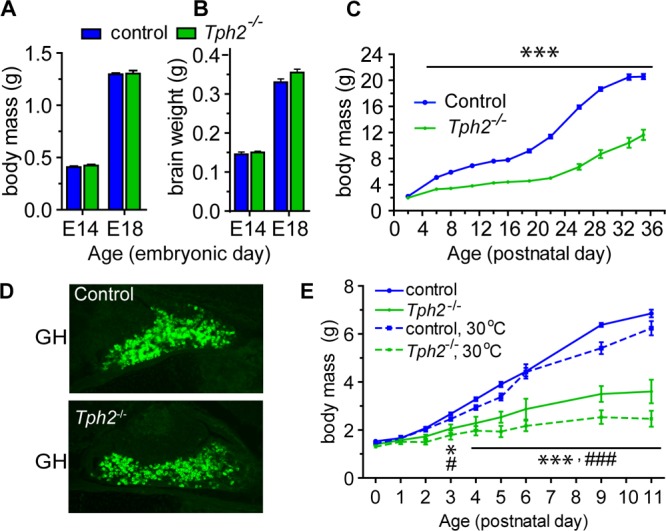
Growth retardation in the Tph2–/– mice. Embryonic growth shows no significant reduction in body mass (A) or brain weight (B) of Tph2–/– embryos compared to control littermates. E14 and E18 = embryonic days 14 and 18, respectively. (C) Postnatal growth curves of control (blue line) and Tph2–/– (green line) pups show a delay in body mass acquisition. The growth of the Tph2–/– mice becomes significantly different from that of control mice by P6 (***p < 0.001, two-way ANOVA). (D) Representative immunofluorescence images of growth hormone (GH) in the pituitary gland of 2-days old Tph2–/– and control mice. (E) Postnatal growth curves of Tph2–/– pups brought up at 30 °C degree (green dashed line) do not differ from the litters grown up at room temperature (green line) (*p < 0.05, ***p < 0.001 vs control mice raised at room temperature; #p < 0.05, ###p < 0.001 at 30 °C; two-way ANOVA).