
Figure 4.
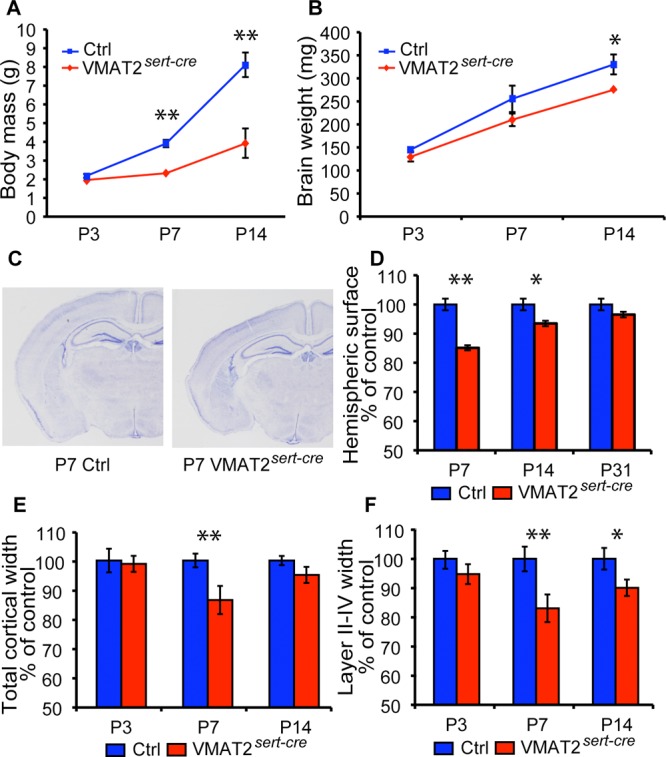
Brain growth and cortical maturation in VMAT2sert-cre mice. (A,B) Body mass and brain growth were compared in separate litters used for the histological analysis at P3, P7, and P14 (independent measures, two different litters per age). This shows that brain growth alterations are much milder than the decrease in body growth. (C,D) The size of a hemisphere was measured from coronal sections through the brain, at a level corresponding to the one showed on the micrographs (level 46 of the Paxinos atlas). This indicated a transient reduction in hemisphere areas at P7 (n = 3 controls and 4 VMAT2sert-cre) and P14 (n = 4 for each genotype) that was no longer significant at P30 (n = 3 controls and 6 VMAT2sert-cre). (E,F) The thickness of the cerebral cortex was measured in the somatosensory cortex. Values are expressed as % of control values. n = 4 for each age/genotype. Values are means ± SEM. (*p < 0.05, **p < 0.01, Student's t test).