
Figure 7.
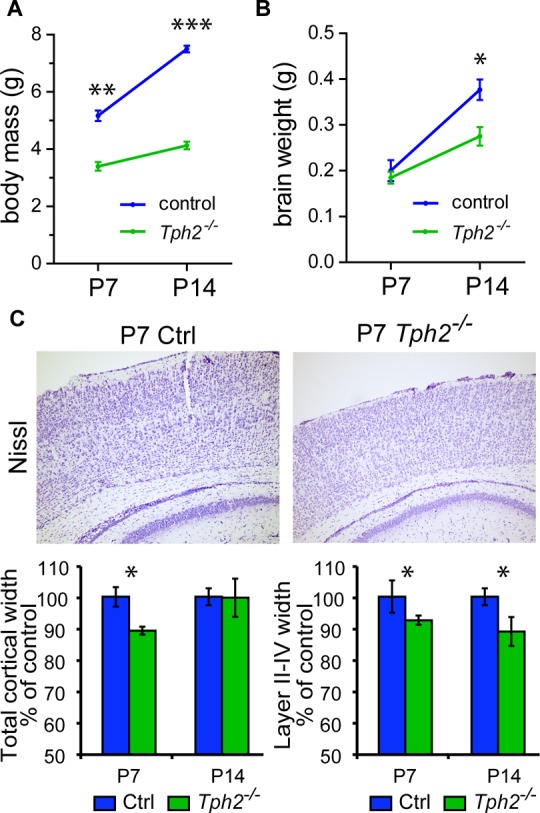
Brain growth and cortical layer maturation in Tph2–/– mice. (A) Body mass and (B) brain wight gain over the first two postnatal weeks in Tph2–/– mice. Student’s t test, *P < 0.05; n = 3 per genotype. (C) Representative Nissl staining and width measurements of the somatosensory cortex and cortical layers II–IV at P7 and P14, respectively. Cortical width was measured at the level indicated on the picture. Values are expressed as % of control. One-way ANOVA followed by Tukey’s post hoc test, *P < 0.05; n = 3 for each age/genotype. Values are means ± SEM.