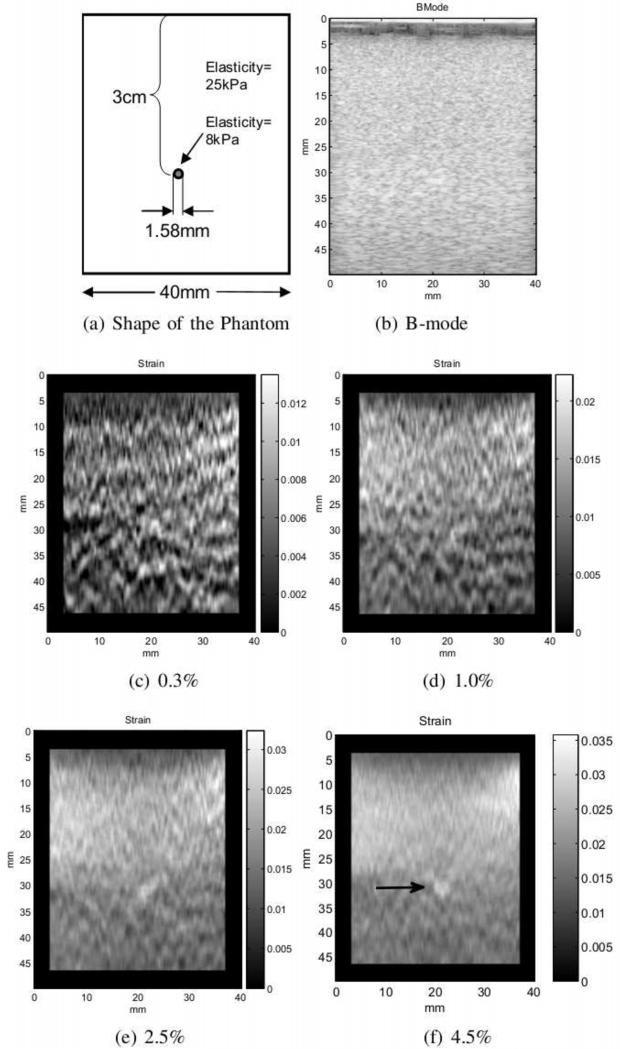
Figure 4.
Four strain images with increasing compression rates are automatically generated from a single sequence. The structure of the phantom is shown in (a). The small lesion is not visible in the B-mode image displayed in (b). (c)-(f) shows the resulting strain image for the selected strain rate. The lesion is clearly visible in (f).

