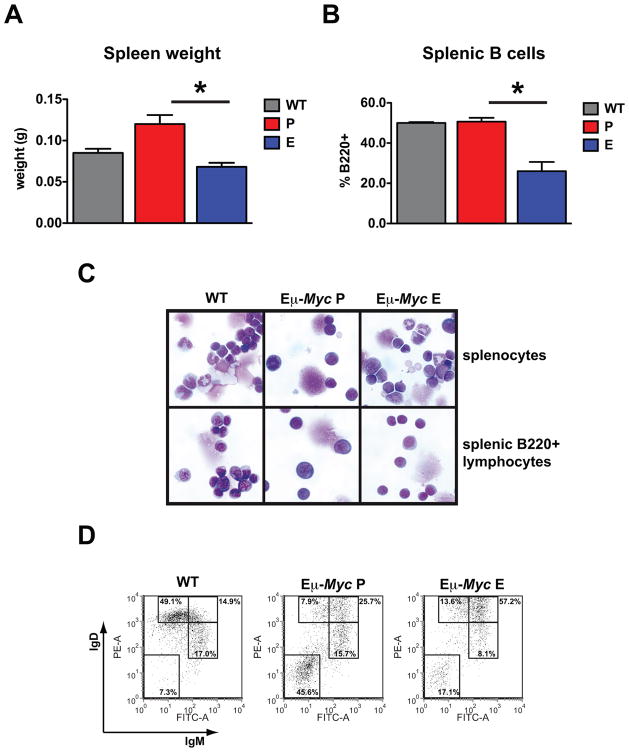
Figure 2. B-cell precursors in the spleen of Eμ-Myc mice are reduced by mTORC1 inhibition.
6–7 week old wild-type littermate control mice (WT) (n=5), Eμ-Myc mice treated with placebo (P) for 2 weeks (n=5) and Eμ-Myc mice treated with everolimus (E) for 2 weeks (n=7) were analyzed. (A) Average spleen weight (P vs E, p=0.001). (B) Percent B220+ splenocytes (P vs E, p=0.001). (C) May Grunwald-Giemsa stained cytospin preparations of unsorted splenocytes (top) and purified B220+ cells (bottom) in a representative mouse from each group. (D) FACS plots showing surface expression of IgM and IgD in B220+ gated splenocytes for a representative mouse from each group. Error bars represent the SEM. p values were generated using a Student’s unpaired 2-tailed t-test, *=p<0.05.

